Inaugural addresses: SAD.
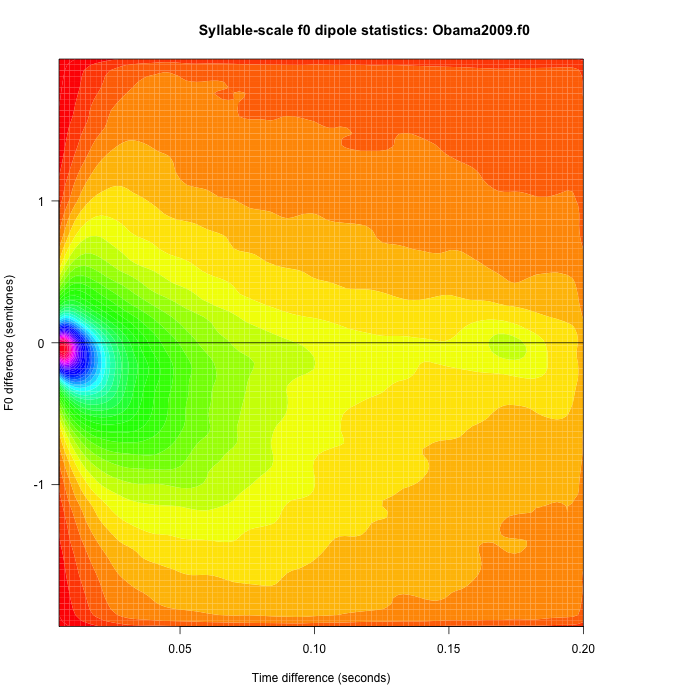
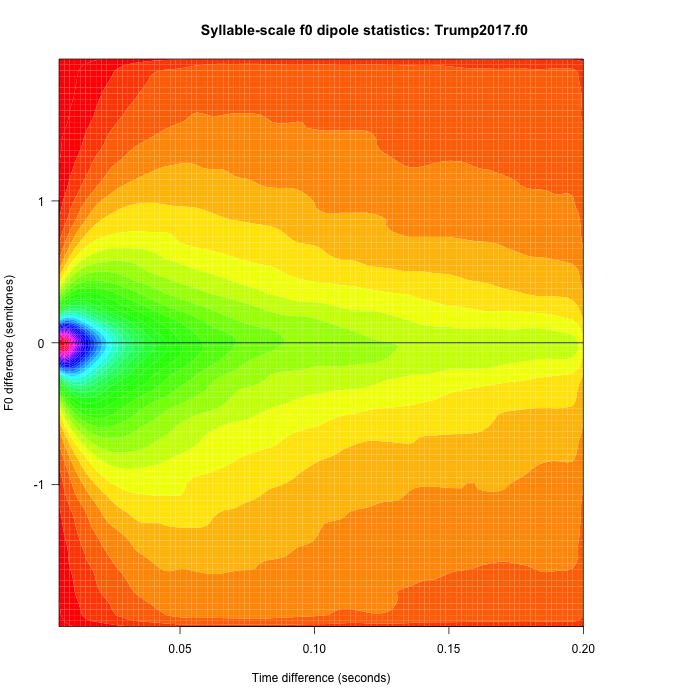
A few days ago, I posted some f0-difference dipole plots to visualize the contrast between Barack Obama's syllable-level pitch dynamics and Donald Trump's ("Tunes, political and geographical", 2/2/2017):
| Obama 2009 Inaugural Address | Trump 2017 Inaugural Address |
 |
 |
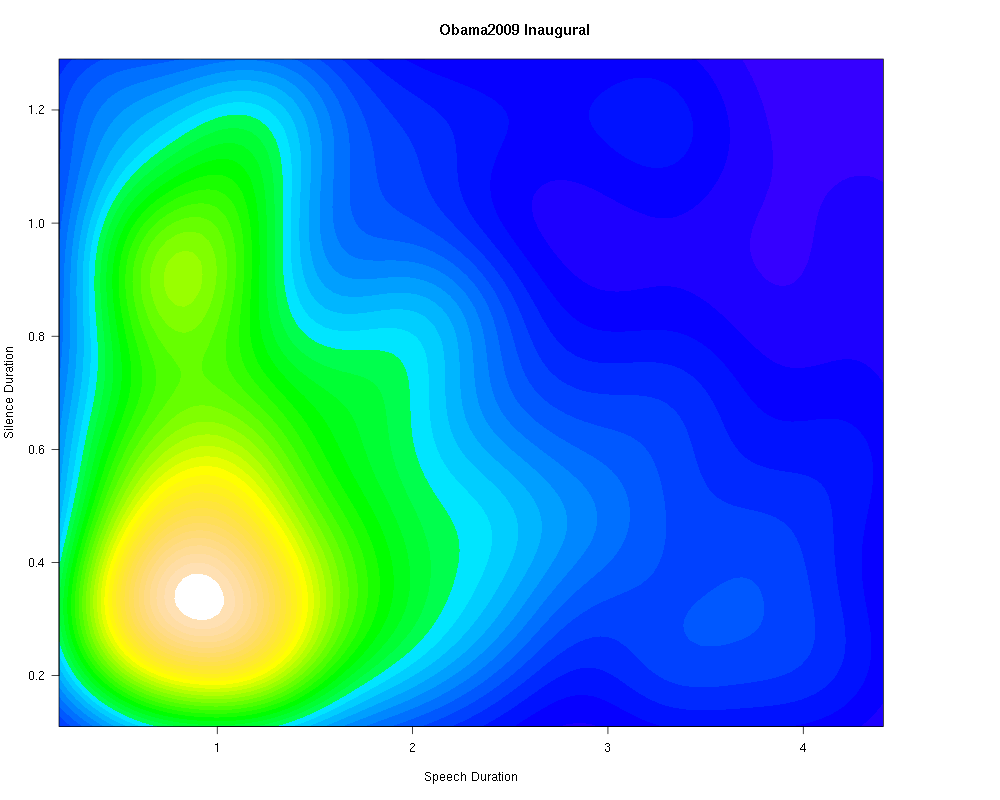
For another take on the same contrast in political prosody, I ran a "Speech Activity Detector" (SAD) on the recordings of the same two speeches, and used the results to create density plots of the relationship between speech-segment durations and immediately following silence-segment durations:
| Obama 2009 Inaugural Address | Trump 2017 Inaugural Address |
 |
 |
Read the rest of this entry »
Permalink Comments off
