Some visualizations of prosody
« previous post | next post »
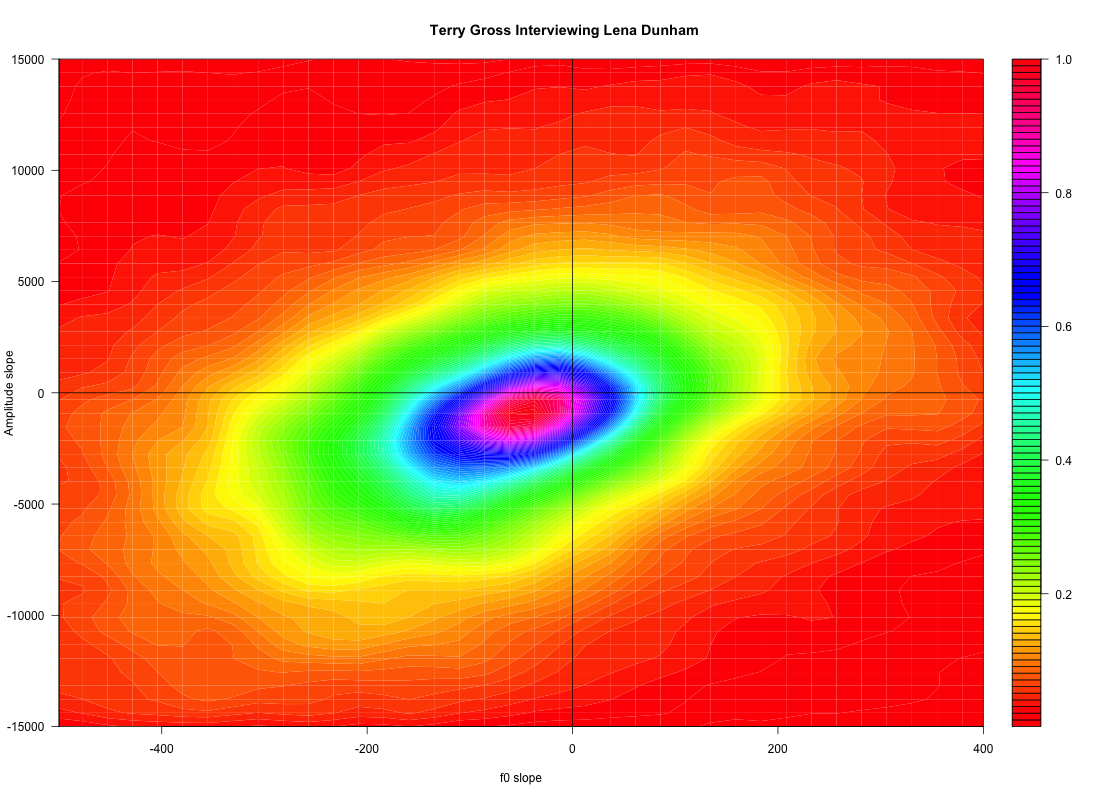
This post presents some stuff I did last March — I thought I had blogged about it but apparently I only put it into these lecture notes. It came up in some discussions today in Shanghai, because I thought that maybe similar visualizations might help explore prosodic differences between the speech of English native speakers and Chinese learners of English. This is going to get a little wonkish, so let's start with a picture:
The idea is to look at the two-dimensional density distribution of the f0 slope (rate of pitch change) and the amplitude slope (rate of loudness change). The speech data for this particular plot comes from the host's side of a 45-minute FreshAir segment,first aired in September of 2014, in which the host Terry Gross interviews Lena Dunham ("Lena Dunham On Sex, Oversharing And Writing About Lost 'Girls'", FreshAir 9/29/2014).
For symmetry, here's the same plot for Lena Dunham's speech in the same interview:
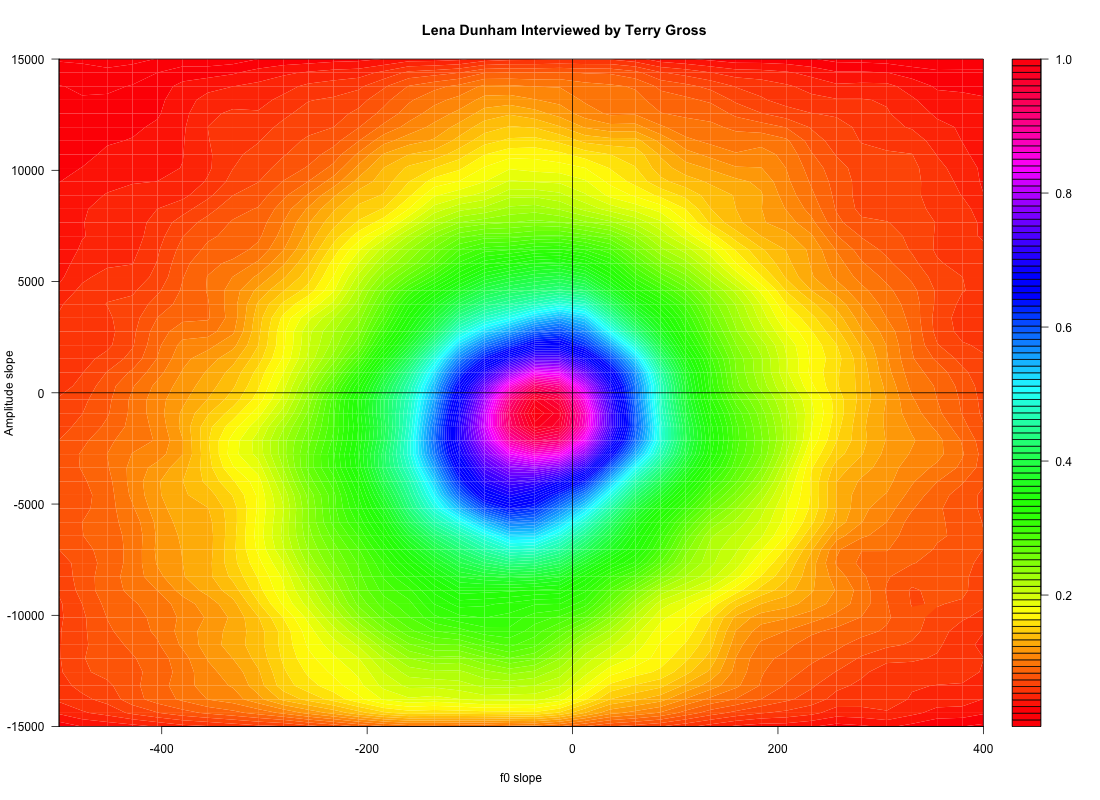
The reason for looking at the bivariate distribution of pitch and amplitude slopes is that rises and falls in amplitude are a pretty good proxy for syllable structure — syllables are typically "sonority peaks".
So those plots are telling us that for both speakers, both pitch and amplitude are falling more often than not, at least in the voiced part of syllables. The preponderance of amplitude falls (in voiced regions) reflects the fact that syllable onsets are generally more abrupt than syllable offsets — there are a smaller number of abrupt rises, and a larger set of more gradual falls. And the preponderance of f0 falls reflects the fact that in American English — or at least in the version of it revealed in this particular interview — local f0 motion is generally falling. In musical terms, English intonation tends to fall by step and rise by leap, just as melodies do in many musical traditions. And therefore at a frame-by-frame scale, negative f0 slopes are much more common than positive ones.
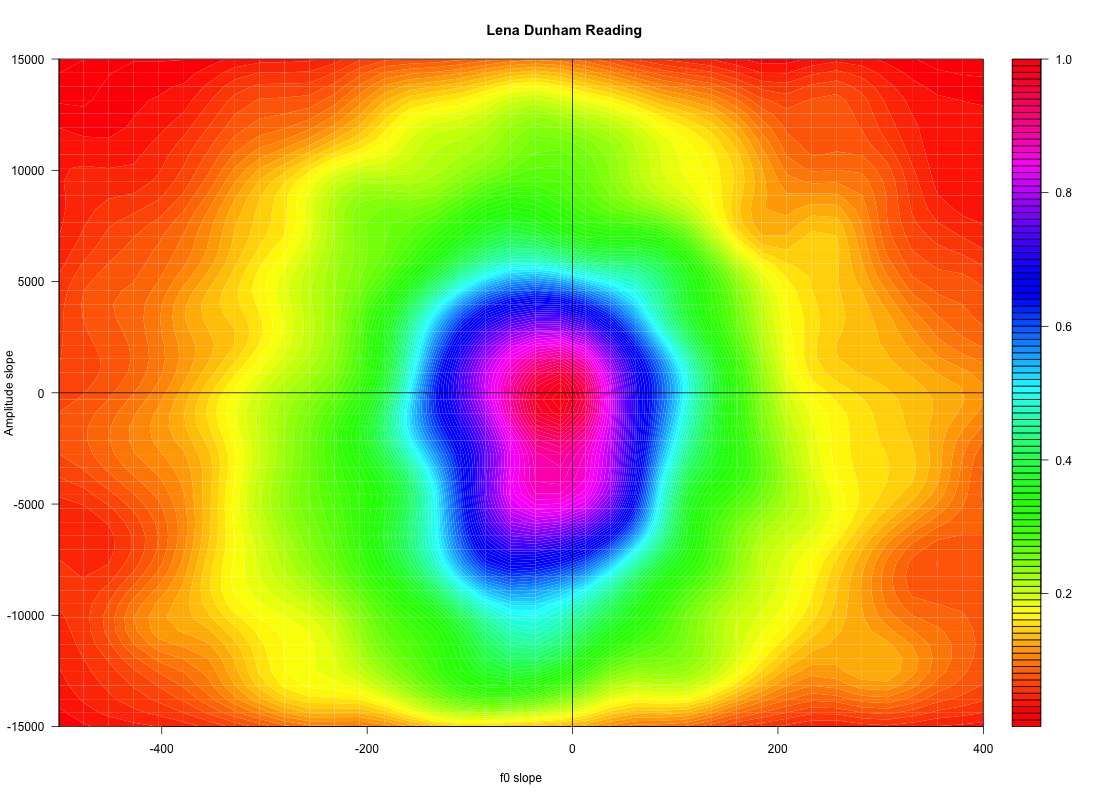
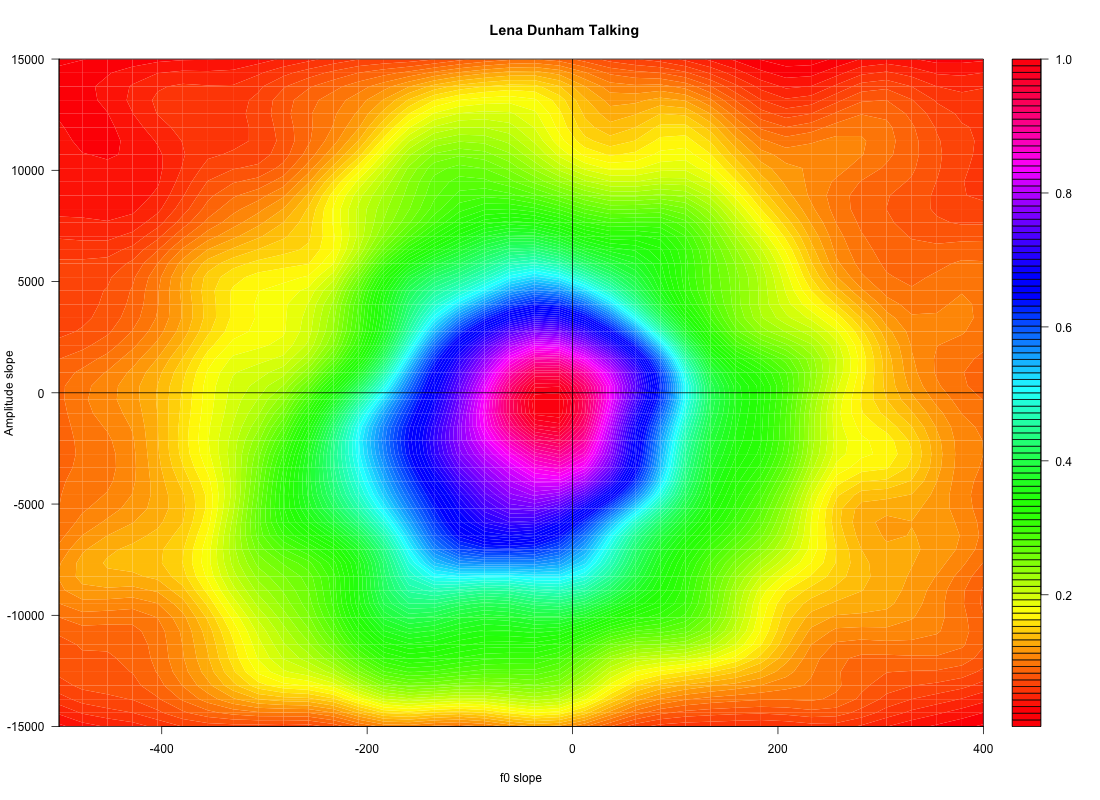
Still, there are some obvious differences in the two women's distributions. And in fact there's a difference between Lena Dunham's speech when she's reading a passage from the book she was promoting, versus her spontaneous conversation elsewhere in the interview:
Now with apologies, here's a slightly wonkish intervention. Anyone who's worked with pitch trackers will be wondering how I can avoid having these plots overwhelmed by noise due to the commonplace scattering of local f0 estimates at the start and end of syllables. For example, here's the f0 track from one fairly typical syllable on Lena Dunham's side of the interview under discussion — f0 is estimated 200 times a second, i.e. every 5 milliseconds:
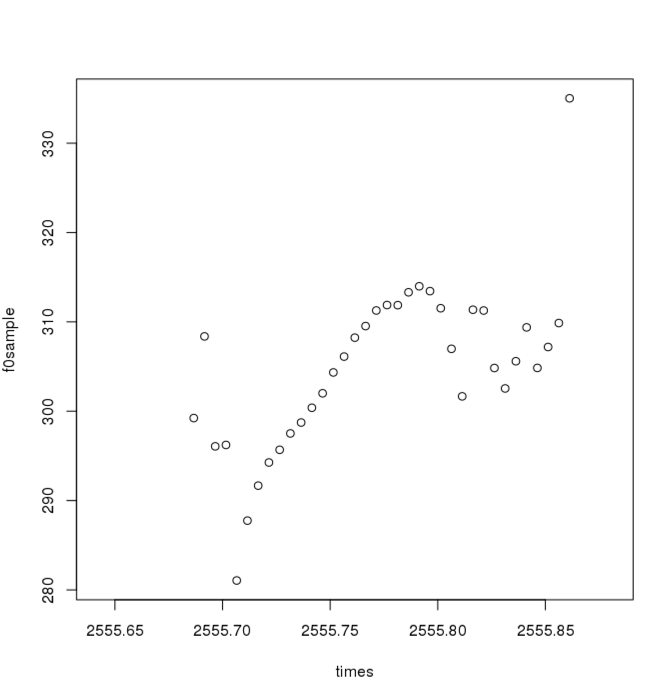
If we just took the first difference of the f0 estimates, the rates of change estimated for the 20 or so smoothly-varying points would be overwhelmed by estimates from the 17 or so scattered points. One approach would be to apply a linear smoother to the vector of estimates. What I did instead was this:
For each sequence of five consecutive voice frames (i.e. 25 milliseconds), check that the mean frame-to-frame absolute value of the f0 changes is less than 20 Hz. If so, then calculate the regression slope for the amplitude and f0 estimates for those five frames; otherwise, ignore them.
If you're curious, see these lecture notes for some further details.
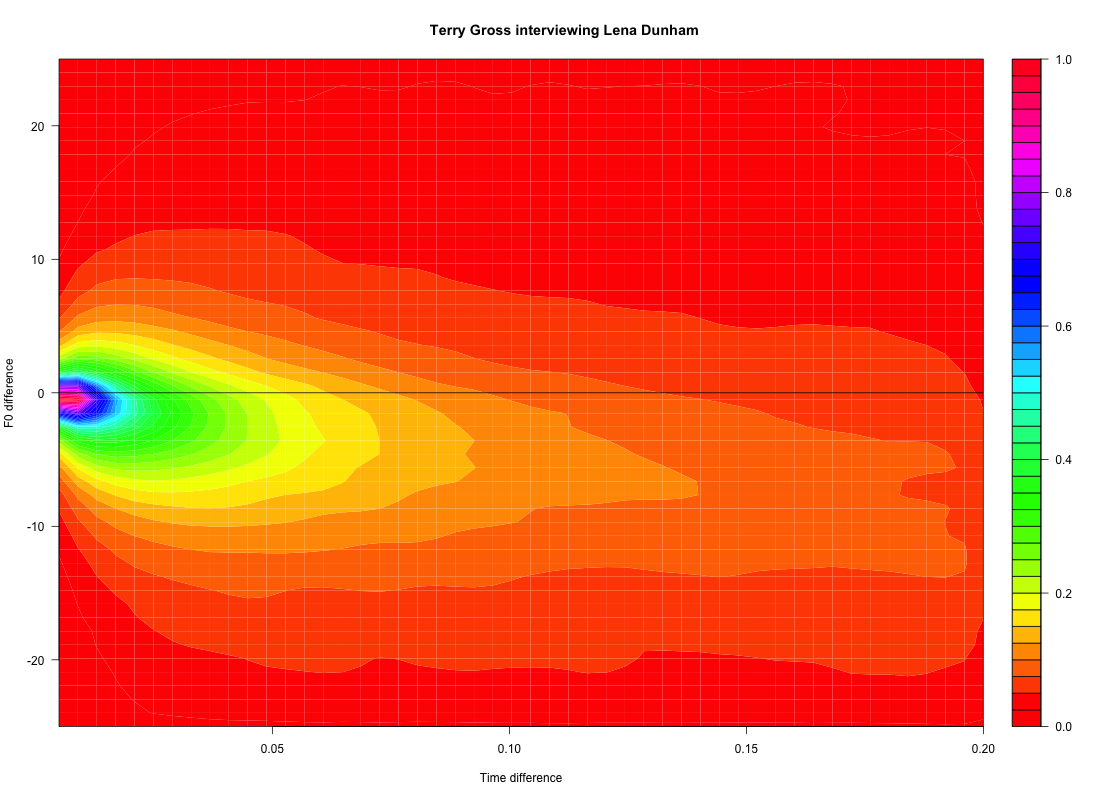
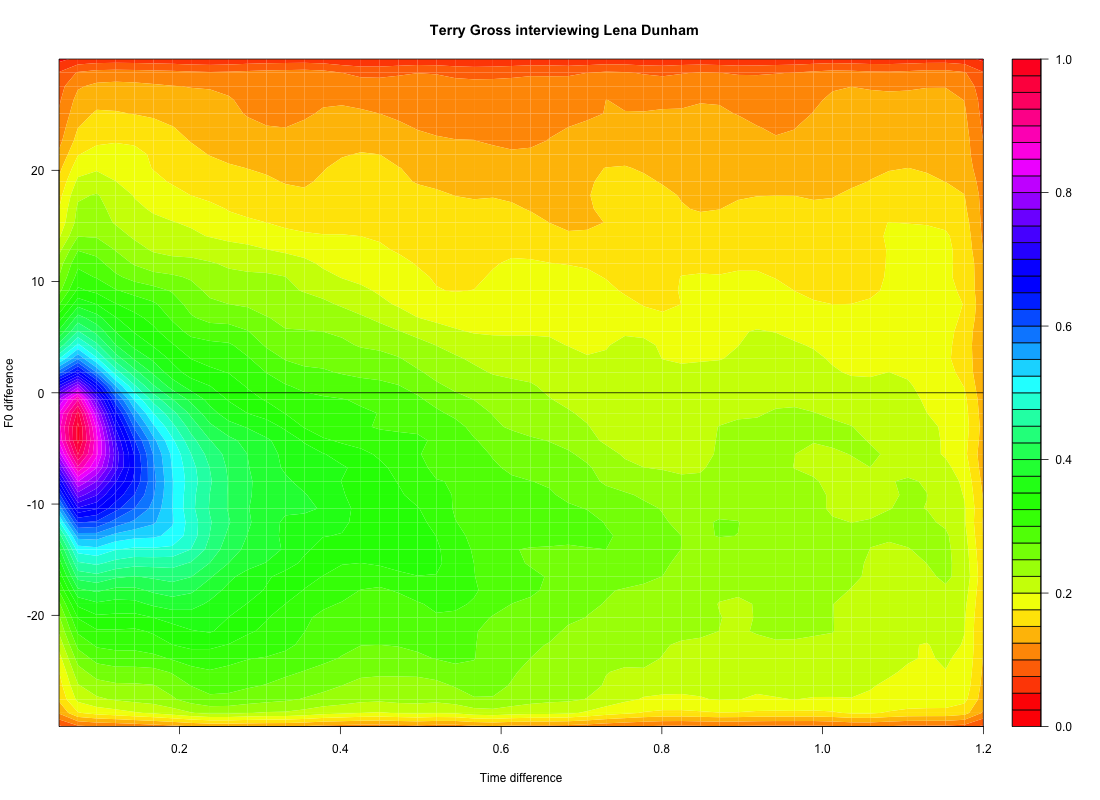
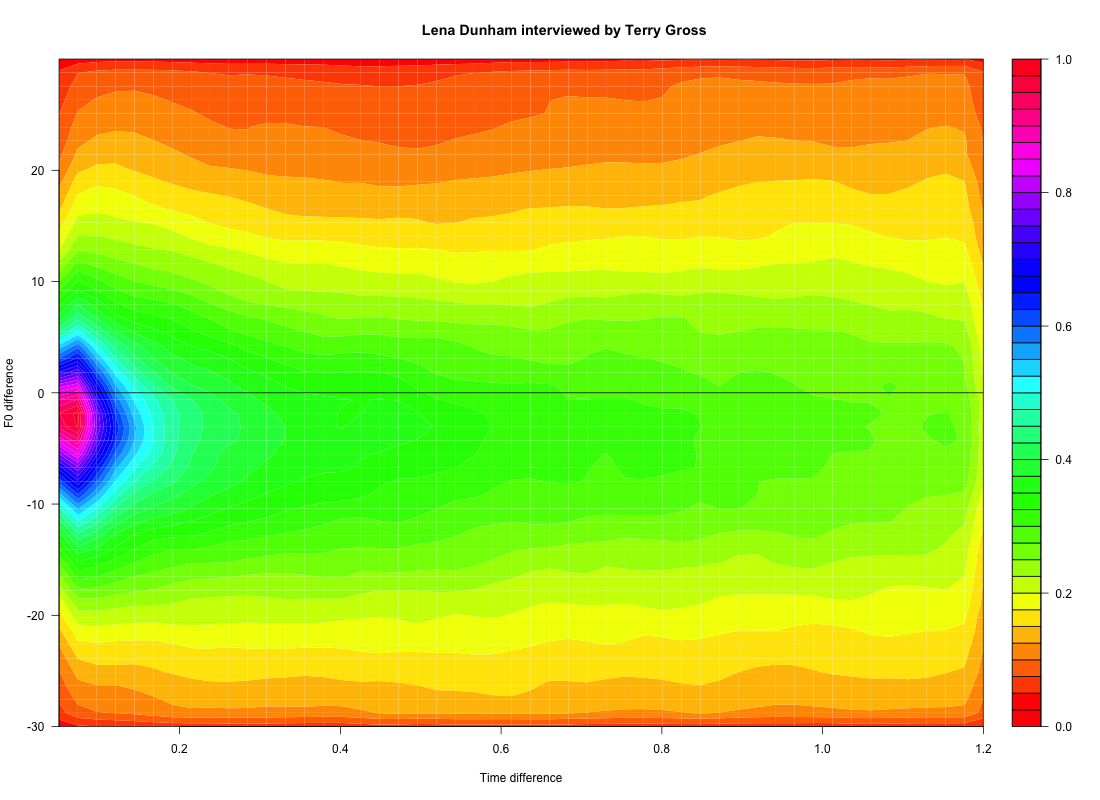
Another way to get at the same issues would be to look at a density plot of dipole statistics. Here we ask, at every possible time difference between estimated f0 values, what the distribution of f0 differences is. The result is a 3-dimensional plot where one axis is time difference, another axis is f0 difference, and the third one is the relative frequencies of pairs of points with that time difference and pitch difference.
If we limit the time difference to syllabic scale — say 0 to 200 milliseconds — we get this for Terry Gross in the cited interview:
And this for Lena Dunham:
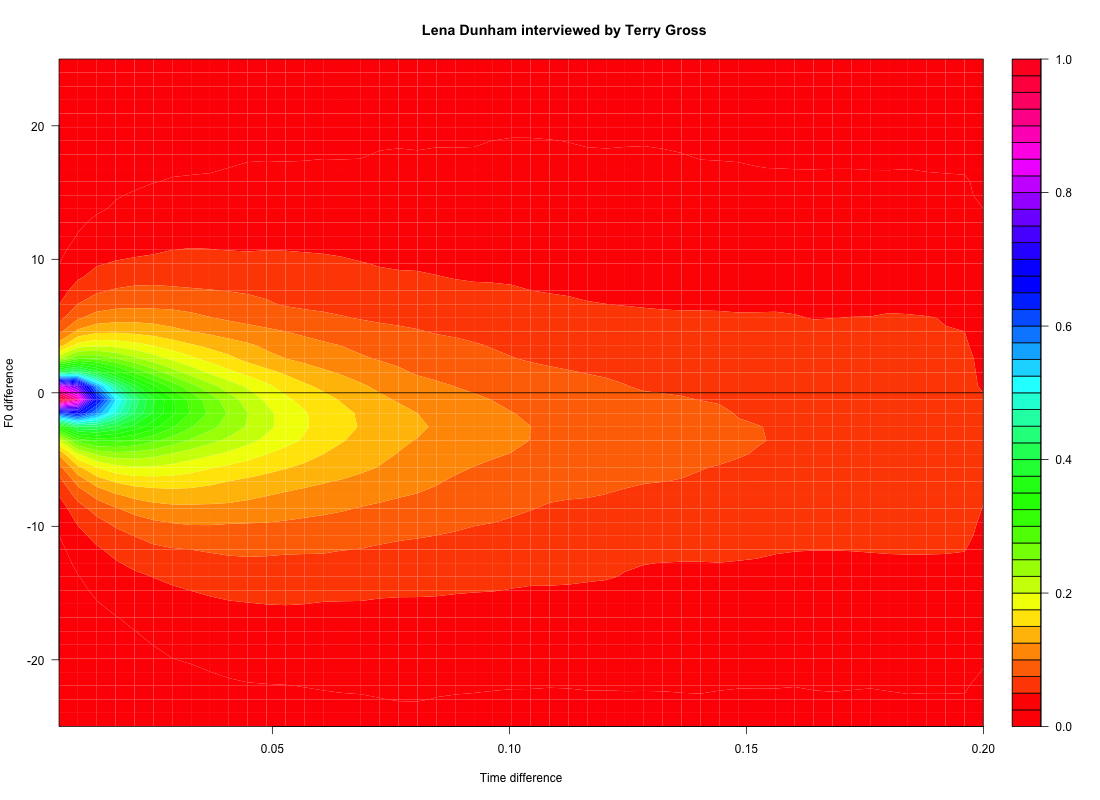
Again we can see that syllable-scale f0 is mostly falling. And we don't need to impose any exclusions on f0 estimates or do any smoothing — the plots are just based on an inventory of all pairs of f0 estimates separated by a given time difference.
If we look instead at phrasal-scale time differences, we see that downtrends continue quite clearly in the host's speech, out to time differences of a second and beyond:
But Lena Dunham gets closer to an even distribution of overall rises and falls as we look at time differences greater than half a second or so:
From what I've seen of English as spoken by Chinese learners, it seems possible that plots of this kind might help to visualize some of the prosodic differences.
[Note: I'm well aware that "pitch" and "loudness" are psychological terms that are not at all the same as the physical measures of fundamental frequency (f0) and amplitude — I've occasionally used "pitch" and "loudness" in this post, perhaps foolishly, to try to make it more accessible.]
Bob Ladd said,
October 23, 2016 @ 9:36 am
From the introductory paragraph I was expecting a plot of Chinese-accented English. Any chance you could produce one of those?
[(myl) Soon, I hope. For some background, see e.g. Daniel Hirst and Hongwei Ding, "Using melody metrics to compare English speech read by native speakers and by L2 Chinese speakers from Shanghai", Interspeech 2015; and Hongwei Ding, Ruediger Hoffmann, & Daniel Hirst, "Prosodic Transfer: A Comparison Study of F0 Patterns in L2 English by Chinese Speakers", Speech Prosody 2016. Their methods don't take account of the relative alignment of pitch movements and syllable structure, which is why I thought that the bivariate density of f0 slope and amplitude slope might be a useful thing to look at.]
Robert Fuchs said,
October 28, 2016 @ 5:05 am
I really liked this post, especially the method to adjust for the inaccuarcy of automatic f0 tracking. I also think that considering the simultaneous variability of acoustic correlates (such as intensity and f0) is very important for a better understand of speech rhythm. If I may shamelessly point to my own work here: I created rhythm metrics that track the simultaneous variability of duration and f0 ( http://bit.ly/2eNVgNz – Towards a perceptual model of speech rhythm: Integrating the influence of f0 on perceived duration) and duration and loudness ( http://bit.ly/2eYsJB8 – Integrating variability in loudness and duration in a multidimensional model of speech rhythm: Evidence from Indian English and British English ) and applied this to Indian English and British English speech. This goes in a direction that is closely related (though obviously not identical) to what you are doing.