The dynamics of talk maps
« previous post | next post »
Over the years, across many disciplines, there have been many approaches to the analysis of conversational dynamics. For glimpses of a few corners of this topic, see the list of related posts at the end of this one — today I want to sketch the beginnings of a new way of thinking about it.
Well, actually, not so new. This started as preparation for the workshop on "Enhancement and Analysis of Conversational Speech" that I led at JSALT 2017 , where a key goal was better diarization, e.g. "automatic analysis of who spoke when, including accurate identification of overlaps when two or more people are speaking at the same time."
And the basic idea was a simple one. Reduce a conversation among N participants to N sequences of binary vectors, sampled every 10 milliseconds or so, representing whether or not participant n was speaking or not at time t. We could call such a conversational schematic a "talk map".
A stochastic model of such talkmaps could then be used as a Bayesian prior for a diarization algorithm. There's an illustrative sample plot on our JSALT plan page, and I explored such models a bit during the 2017 workshop — but we never got to the point of actually applying one.
Recently the idea has come up again, from the opposite angle. Rather than using such a model as a prior for diarization, we could fit such a model to a talkmap derived from the (correct) diarization of a given interaction, and use the resulting parameters as features for analyzing the behavior of the participants.
Of course, there could be many reasons for any particular pattern: the personalities, moods, caffeinations, and skills of the participants; their relationships; the physical, social, and cultural context of the interaction; and so on. But still…
Today, I'll show a preliminary (numerical and graphical) exploration of a couple of examples from the "CALLHOME" datasets of conversational telephone speech, collected at the LDC 20-30 years ago in English, Spanish, Mandarin, Japanese, German, and Egyptian Arabic. Stay tuned for discussion of next steps and what it all might mean.
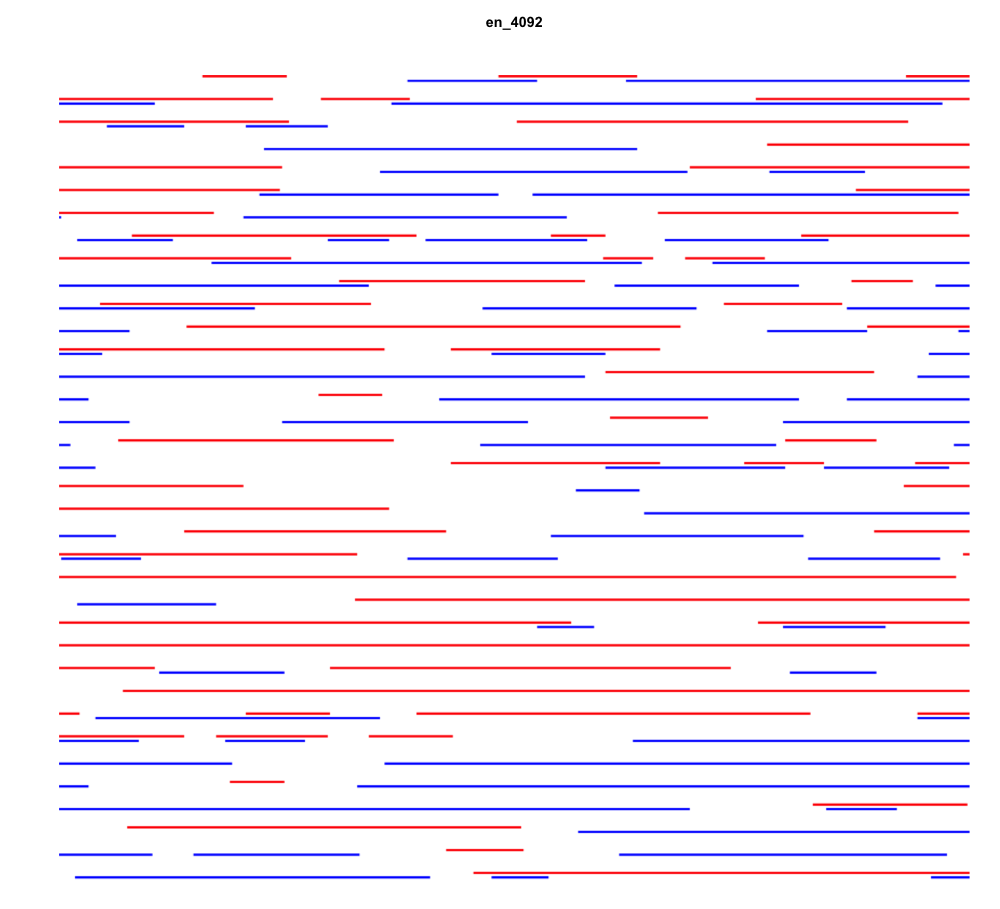
Because the two telephone channels are well separated in these 30-minute calls, a simple "speech activity detector" can automatically create an accurate picture of who spoke when. A graph of this talkmap for (the published portion of) American English conversation 4092 looks like this — speaker A is in red and speaker B is in blue, and time runs left-to-right and top-to-bottom, as in standard English-language text:
At the level of 10-msec frames, someone is speaking 81.3% of the time in this conversation, leaving 18.7% of "dead air" where neither party is speaking. Speaker A talks 41.6% of the time (35.5% as the only speaker); Speaker B talks 45.8 percent of the time (39.7% as the only speaker); and both talk at once 6.1% of the time.
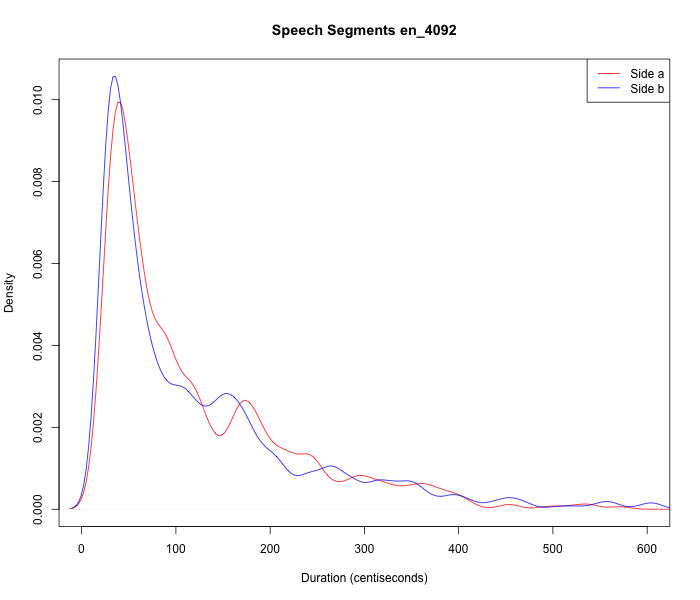
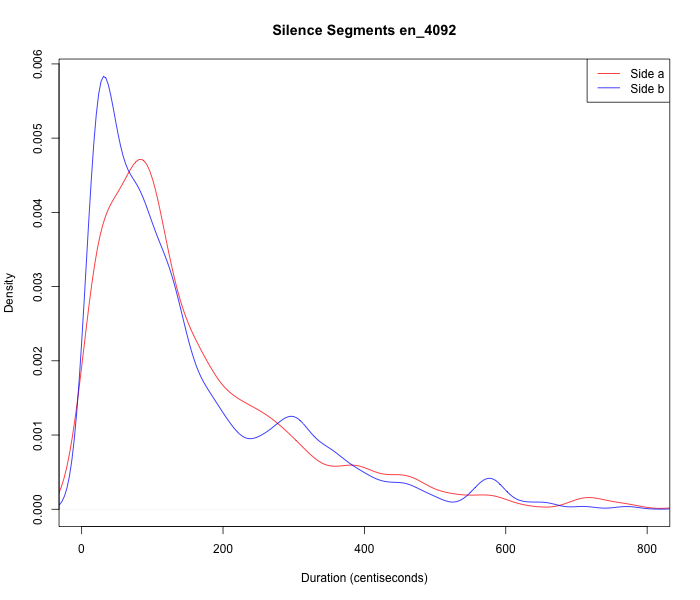
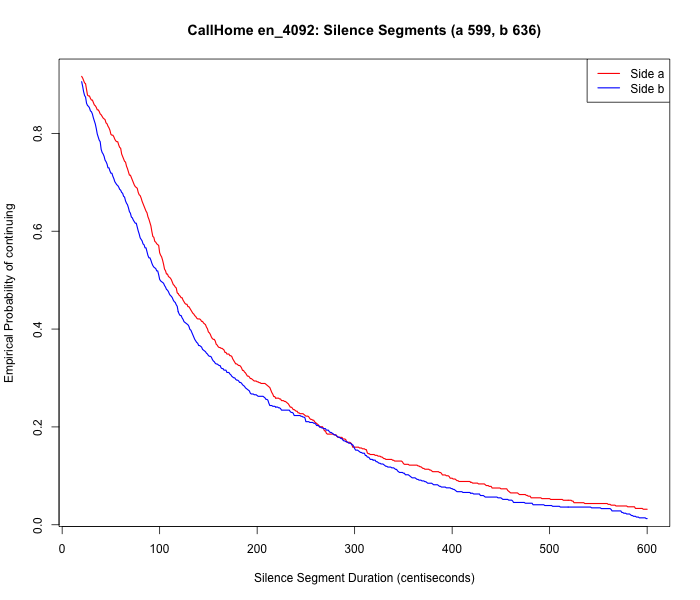
We can also easily calculate each side's distribution of speech-segment durations and silence-segment durations, which in this case are pretty similar for the two participants:
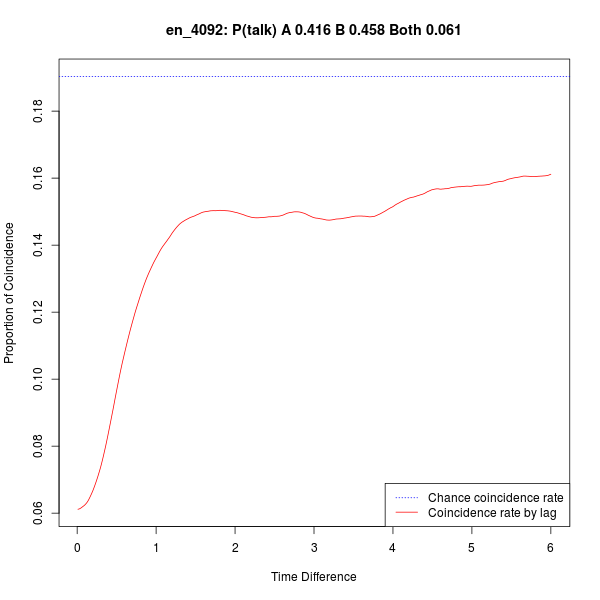
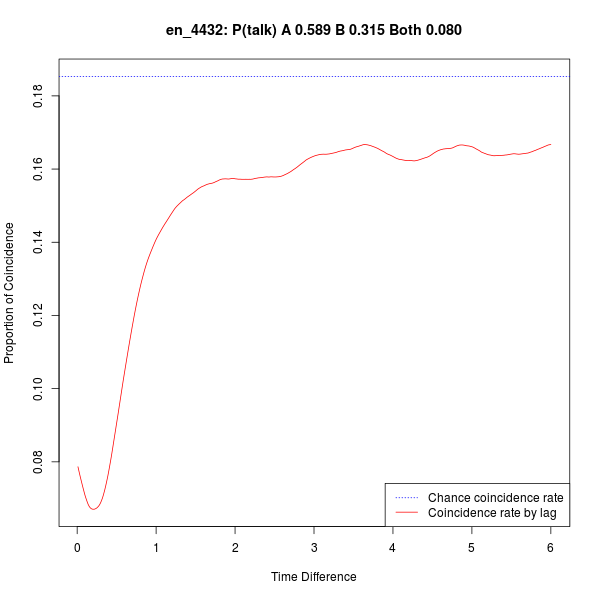
If the participants were not coordinating their turns, we'd expect them to be talking at the same time 19.1% of the time (0.416*0.458 = 0.191) rather than 6.1%. One measure of their coordination is the fact that the coincidence rate increases to more than 15% if we compare the two sides across a variable time lag:
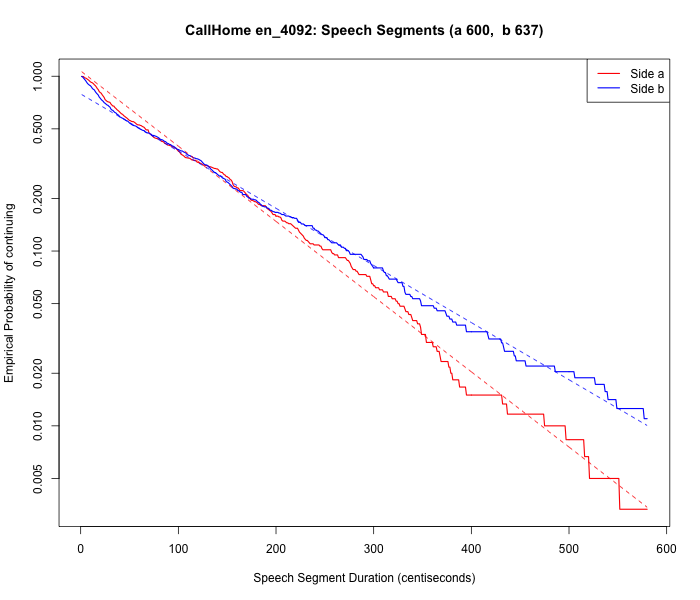
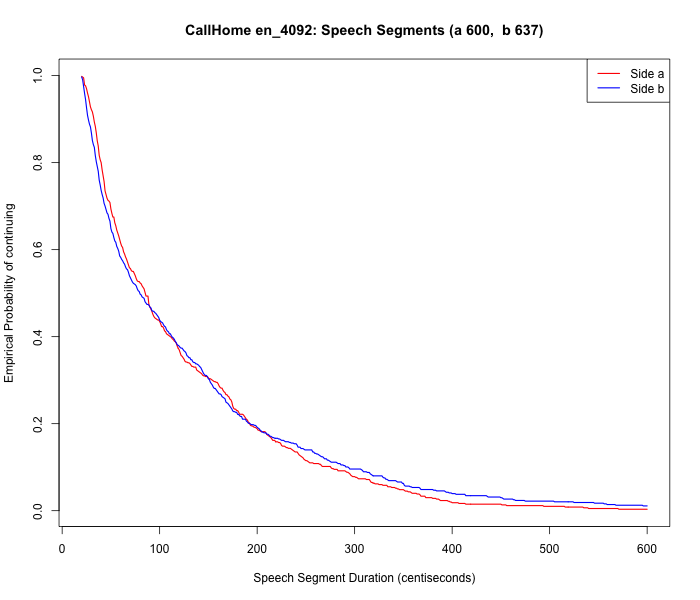
And if we compare each side's probability of continuing to talk after a given duration of speaking, we see very similar quasi-exponential decays:
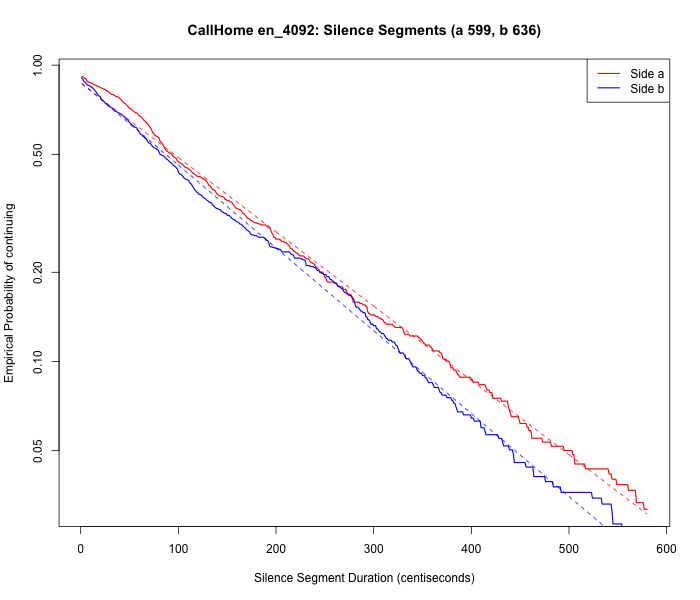
And likewise for the analogous calculation of their probabilities of remaining silent after a given period of silence:
(Note that this decaying probability of continuing suggests a "tiring Markov process" of the kind discussed in "Modeling repetitive behavior", 5/15/2015…)
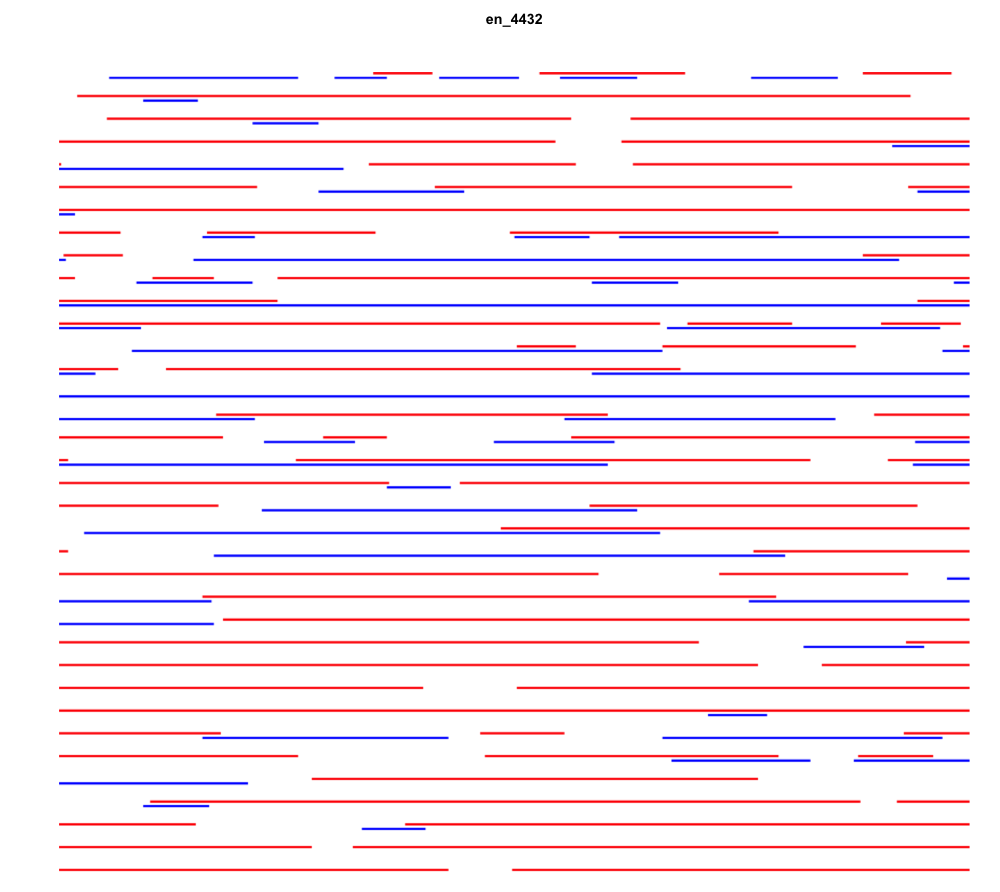
Sometimes the patterns are rather different — the talkmap for American English conversation 4432 looks like this:
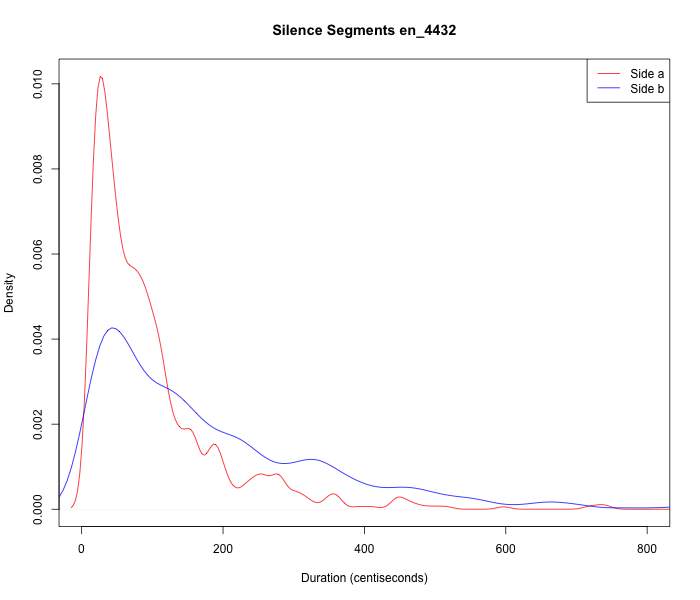
In this case, someone is speaking 82.4% of the time, leaving 17.6% "dead air" — very close to the 81.3% and 18.7% we saw for the previous conversation. However, the balance between the speakers is now quite different: here speaker A talks 58.9% of the time (50.9% as the only speaker), and speaker B talks 31.5% of the time (23.5% as the only speaker). Both talk at once 8.0% of the time. (Note also that the dynamics seem to be different in different parts of the conversation…)
And of course the distributions of speech-segment and silence-segment durations are also rather different in this case:
 |
 |
However, the plot of coincidence by lag is both qualitatively and quantitatively similar to the previous one:
(Though the coincidence-by-lag patterns for other conversations can be quite different…)
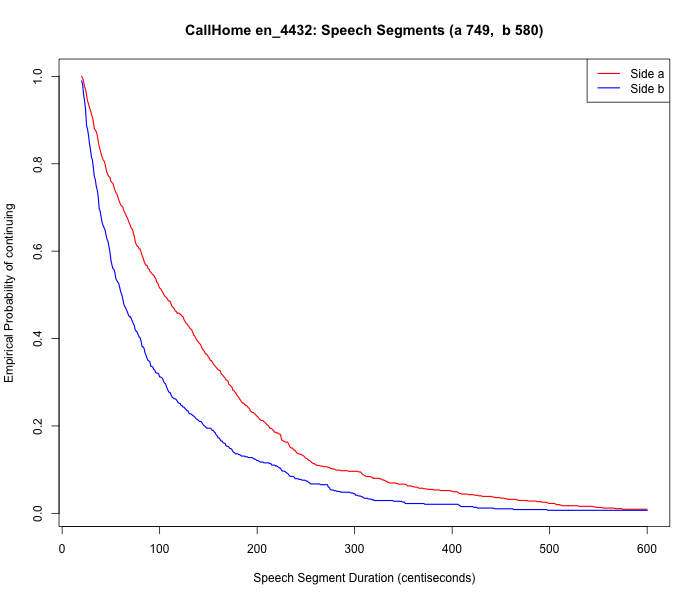
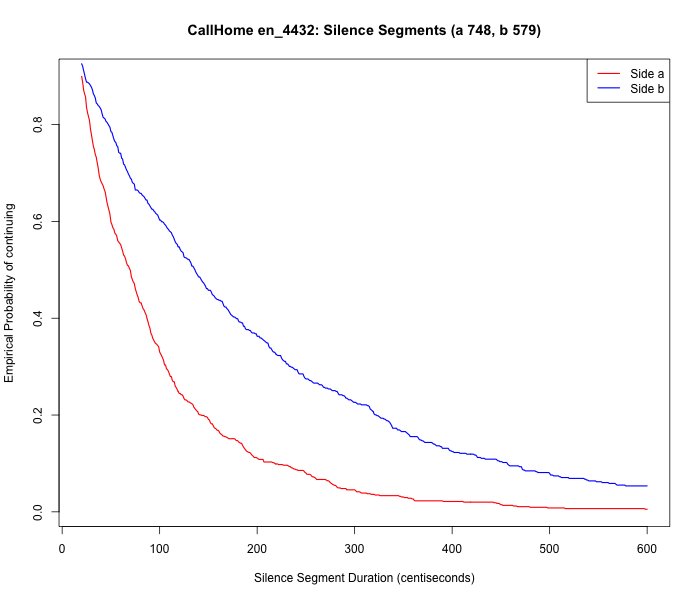
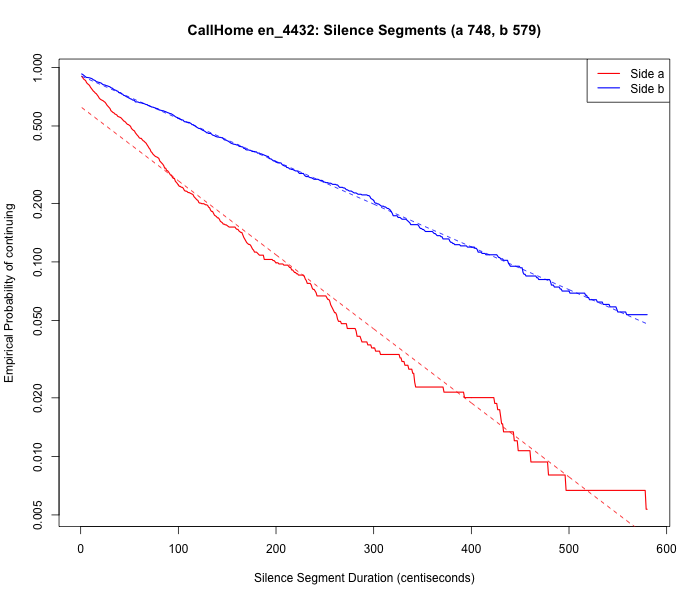
And in this conversation, the empirical-probability-of-continuation patterns show rather different decay rates for the two speakers:
 |
 |
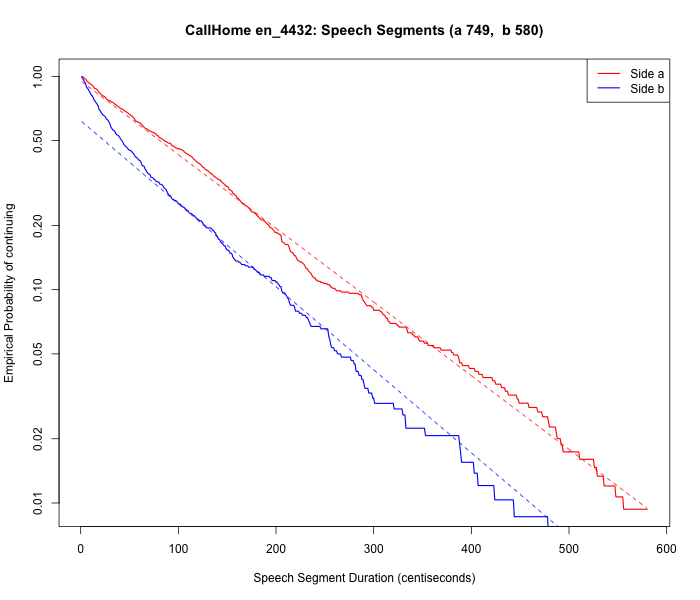
To support the plausibility of talkmap decay-rate parameters as features of conversational dynamics, here are y-axis-log versions of those last plots with fitted exponential models:
 |
 |
Compare the fitted decay-graph lines for conversation en_4092, where the two participants' parameters are more similar:
 |
 |
Topics for future Breakfast Experiments™ include the extraction of various other useful features from talkmaps, and comparisons of those features as a function of (interactions among) language, culture, age, gender, personality, topic, and so on.
The promised list of post on aspects of conversational dynamics:
"Turn-taking etiquettes" (10/21/2007)
"Yet another 'yeah no' note" (4/4/2008)
"The meaning of timing" (8/7/2009)
"Two cultures" (3/20/2010)
"Marmoset conversation" (10/21/2013)
"Speaker-change offsets" (10/22/2013)
"Men interrupt more than women" (7/14/2014)
"Some constructive-critical notes on the informal overlap study" (7/16/2014)
"More on speech overlaps in meetings" (7/16/2014)
"Gender, conversation, and significance" (7/26/2017)
And for more background on "tiring markov processes", see
Jerry Packard said,
September 30, 2022 @ 11:40 am
This is marvelous; it extends Conversation Analysis into an interesting and useful multivariate mode of analysis.
Cervantes said,
October 1, 2022 @ 7:48 am
In my own work, I label speech acts, and use the speech act count rather than the clock as a measure of participation. This seems more valid because people speak at different rates, have more or less filler, may repeat themselves (outright repetition gets labeled as a single speech act.) Also, of course, you can analyze the nature of the speech acts (forms of questions, representatives, expressive, directives, etc.). We find, for example, that in medical encounters physicians produce about 70% of speech acts, make almost all of the directives, ask more questions, etc. In motivational interviewing, in contrast, clients do much more talking. Speech act count correlates with clock time about .87, so it's not a big difference.