MLK day: Pitch range
« previous post | next post »
In honor of MLK day, I've replicated something that Corey Miller did for a term paper in an introductory phonetics course in the early 1990s. The point of the exercise is that any given speaker can exhibit a wide variety of different pitch ranges. 25 years ago this was a somewhat complicated business, involving digitization of tape recordings, use of expensive high-end computer workstations and so on. Today the whole process from start to end took me less than half an hour, leaving out the time required to write this post. I've put links to the relevant scripts at the end of the post — six lines of shell commands and a dozen lines of R.
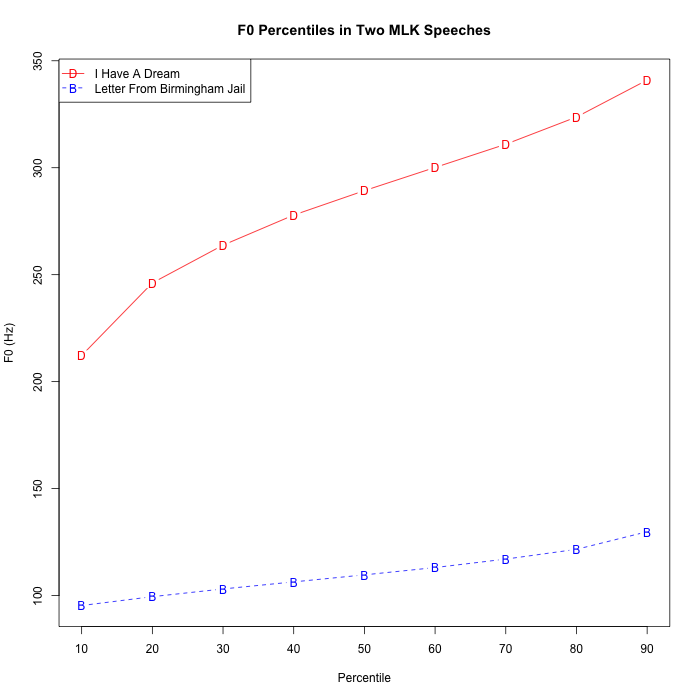
We're comparing Dr. King's famous "I have a dream" speech from August of 1963, and a slightly less famous reading of the "Letter from Birmingham Jail" from April of 1963. Both are available on Youtube, and so it's easy to download them and extract the audio. And it's just as easy to calculate fundamental-frequency estimates and create a graph of the range of pitches employed, here presented as percentiles of f0 values from the 10th to the 90th percentile:
And a table of the values:
   10% 20% 30% 40% 50% 60% 70% 80% 90%
D  212 246 264 278 289 300 311 324 341
B   95  99 103 106 110 113 117 122 130
The reason for looking at things in terms of percentiles rather than in terms of maximum and minimum values is that pitch-trackers commonly scatter a few estimates at one or two octaves above or below what we should probably consider the true value. (In fact, the whole idea of "fundamental frequency" in speech is an abstraction that can lead to all sorts of other troubles if we take it too seriously, but never mind that for now…)
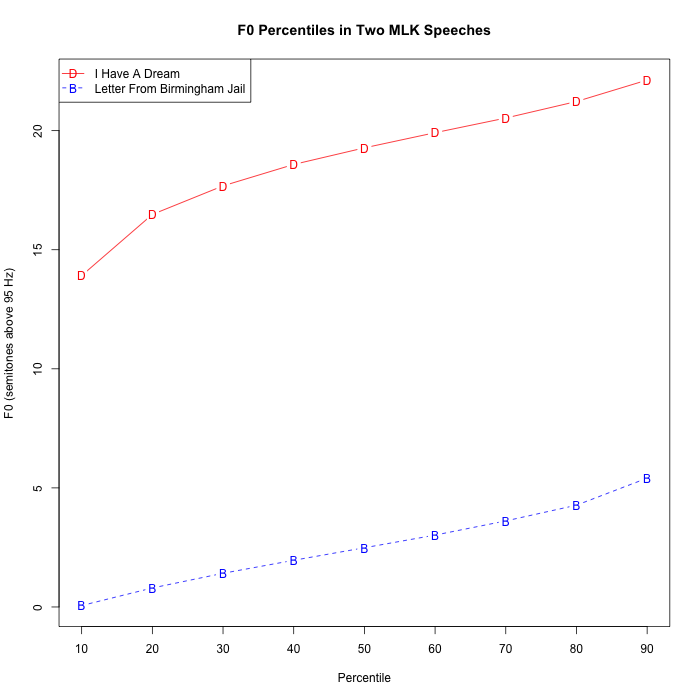
Here's the same data plotted in semitones:
And the table of values:
     10%  20%  30%  40%  50%  60%  70%  80%  90%
D   13.9 16.5 17.7 18.6 19.3 19.9 20.5 21.2 22.1
B    0.1  0.8  1.4  2.0  2.5  3.0  3.6  4.3  5.4
Note that the difference between MLK's pitch range in these two different situations is greater than the typical difference between male and female voices in a given setting — see "Biology, Sex, Culture, and Pitch", 8/16/2013.
The two recordings:
The (Unix shell) commands for getting the audio and doing the pitch tracking (MLKprocess.sh):
getyoutube https://www.youtube.com/watch?v=3vDWWy4CMhE DreamSpeech
getyoutube https://www.youtube.com/watch?v=knFojb020bY BirminghamJail

sox --norm DreamSpeech.mp3 DreamSpeech.wav remix 1 rate 16000
get_f0a -i DreamSpeech.wav -m 80 -x 500 -f .005 >DreamSpeech.af0

sox --norm BirminghamJail.mp3 BirminghamJail.wav remix 1 rate 16000
get_f0a -i BirminghamJail.wav -m 80 -x 500 -f .005 >BirminghamJail.af0
The command "getyoutube" is another simple shell script, linked here. The source code for the command "get_f0a" is here.
And the R script for generating the graphs is here.


leoboiko said,
January 16, 2017 @ 12:14 pm
Where can I read more about the abstraction of "fundamental frequency" and its problems? (I'm especially interested in measuring/visualizing tone in tonal languages, in all its undoubtedly gory phonetic detail.)
[(myl) You could start with this set of presentation slides.
Update — but that will only help if you're already familiar with what pitch tracks look like in general, and for tone languages in particular. If you're just starting out, in addition to reading things, you can download an interactive visualization program that can track and display f0, like Praat or WaveSurfer, and just explore what relevant recordings look like and sound like. If there's interest, I'll post some getting-started instructions.]
Bob Ladd said,
January 16, 2017 @ 1:08 pm
@leoboiko: Some of what you're looking for you might find in the online appendix to my book Intonational Phonology. It's normally available here at the Cambridge University Press website, but they are apparently updating their catalogue pages for the next couple of days. You can get a temporary version of the same thing here, but the links to the sound files unfortunately don't work.
But NB: some of what goes into MYL's references to F0 as an "abstraction" is well beyond the scope of what I put in that appendix, which deals mostly with practicalities.
MLK day: Pitch range • Zhi Chinese said,
January 16, 2017 @ 1:12 pm
[…] Source: Language MLK day: Pitch range […]
AntC said,
January 16, 2017 @ 5:05 pm
How much of the apparent difference in pitch could be explained by different circumstances of recording/different equipment/microphone/etc?
The 'I have a dream' speech was recorded in the open air/on TV microphones. The 'Letter from Alabama' sounds like it was recorded in an enclosed space (!), perhaps using a better quality microphone.
[(myl) Microphones and recording equipment have nothing whatever to do with it. Vocal effort — colloquially known as "raising your voice" — is basically what's responsible. Try recording yourself talking quietly to someone sitting next to you, vs. addressing someone a block away, and you'll see the effect in your own speech.
Here's a similar f0-percentile plot for one of the subjects in the experiment described in Elizabeth Shriberg et al., "Effects of vocal effort and speaking style on text-independent speaker verification", InterSpeech 2008:
The percentiles labelled "1", "2", "3", correspond to "low", "normal", and "high" vocal effort conditions, with the subject seated in the same location in the same room recorded with the same microphone, and vocal effort modulated partly by instructions and partly the location of a putative interlocutor:
]
AntC said,
January 16, 2017 @ 5:09 pm
Errk: 'Letter from Birmingham Jail'
AntC said,
January 16, 2017 @ 6:13 pm
Thank you Mark. I'm thinking:
1. A telephone system (for example) typically reproduces only a narrower range of frequencies. Are you saying that if we played both speeches down a phone, your numbers would still come out the same?
[(myl) Yes, because the relevant measure in the frequency domain is the spacing between overtones, which are integer multiples of the fundamental frequency. In the telephone bandwidth (traditionally up to 3200 Hz, these days maybe up to nearly 4000), an f0 of 100 Hz will have space for 32 to 40 overtones, and an f0 of 400 Hz will still have 8 to 10 overtones.]
2. Since both recordings are from the same speaker, that's the same vocal tract/same fundamental resonance frequency (considered as an organ pipe).
So if your F0 percentages are affected by articulation of the vocal tract, how come they're not also affected by the recording/playback equipment?
[(myl) The fundamental frequency is determined by the periodicity of laryngeal oscillation. The resonances (and antiresonances) imposed by the rest of the vocal tract modulate the resulting spectrum, relatively enhancing some overtones and attentuating others. The result looks something like this (with a vertical line drawn through the tenth harmonic, here at 930 Hz, corresponding to a fundamental of 93 Hz):
A higher-bandwidth recording would extend the frequency scale (to around 22 kHz in the case of the 44.1 kHz sampling rate of "CD quality") but would not change the overtone spacing.]
The whole idea of "fundamental frequency" in speech … troubles …
If there's interest, I'll post some getting-started instructions.
That would be generous, but way beyond what I would expect for my standard subscription to LL. Presumably there's some textbook material you could point us to?
[(myl) There are some good texts, with the best choices depending on your background and interests. But these days it's easy to get software that will let you look around on your own, and that's always a Good Thing, in my opinion…]
Bean said,
January 17, 2017 @ 7:59 am
Interestingly, the f0 doesn't always come through on the phone as the low-frequency cutoff is 300 Hz, but you psychoacoustically fill it in.
[(myl) This is the famous "missing fundamental" phenomenon. But as I indicated above, it's really the overtone spacing that determines the perception of pitch — the presence or absence of the fundamental harmonic itself is pretty much irrelevent. (Though it's easy to create ambiguous stimuli, especially with respect to octave affinity, as the Shepard Tone illusion demonstrates.]
Bean said,
January 17, 2017 @ 12:24 pm
Indeed those continuously-rising (or falling) tones are fascinating (though they give me a headache after a while, I think it's the 100% duty cycle). I remember comparing with a friend as to when we thought it flipped over, where we suddenly thought it was low (or high) again. Our perception of where the shift occurred was different, presumably because he has a much lower voice than mine. I remember reading somewhere that your own voice as heard in your head affects your perception in those ambiguous situations.