Totally Word Mapper
« previous post | next post »
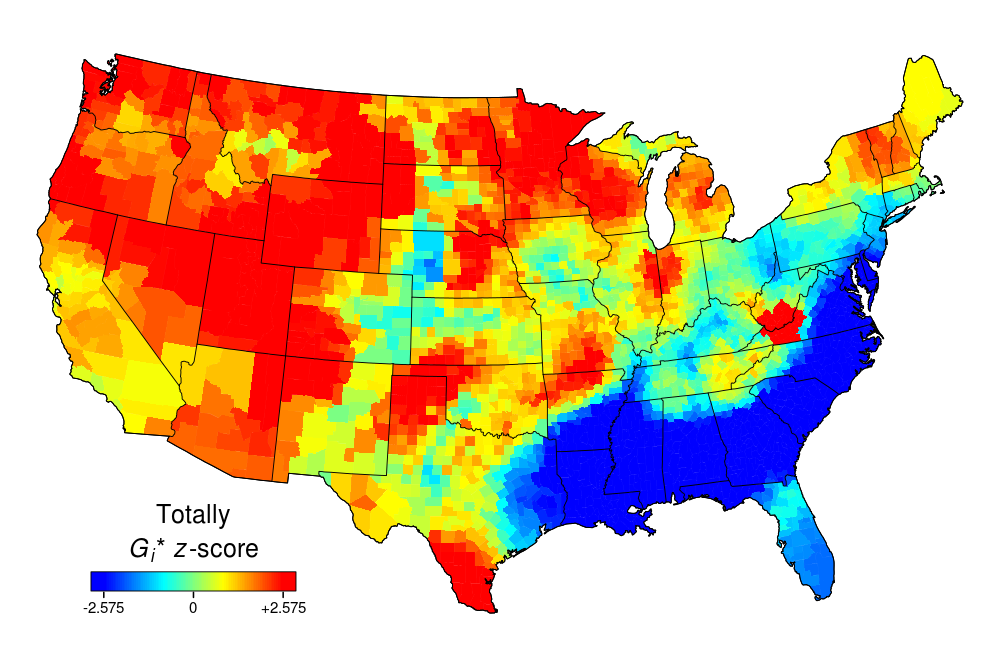
Jack Grieve Twitter-based Word Mapper (see "Geolexicography", 1/27/2016) is now available as a web app — like totally:
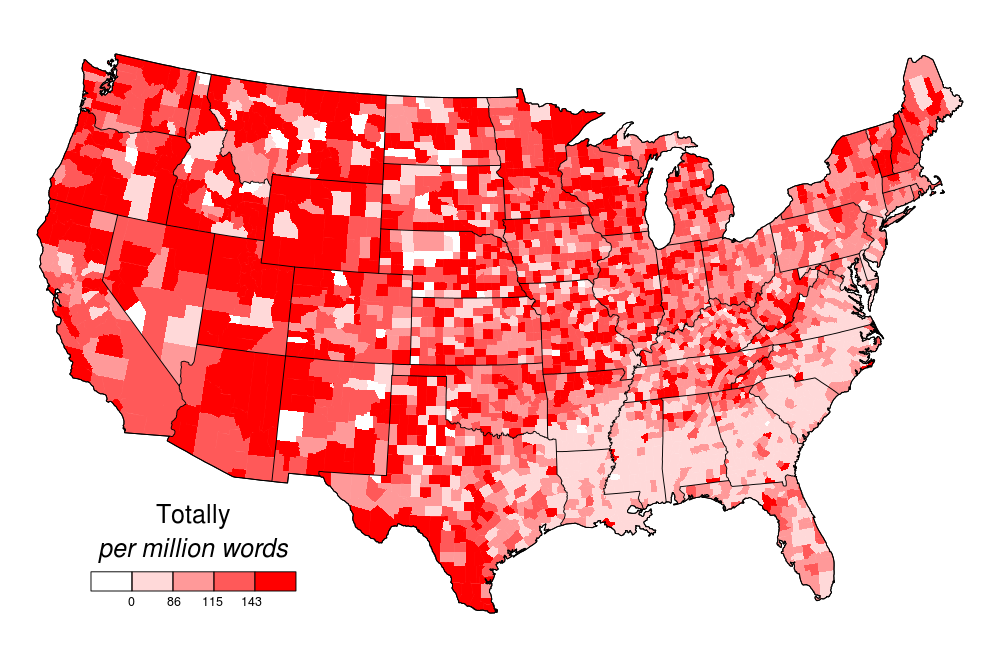
Or in terms of local frequency:
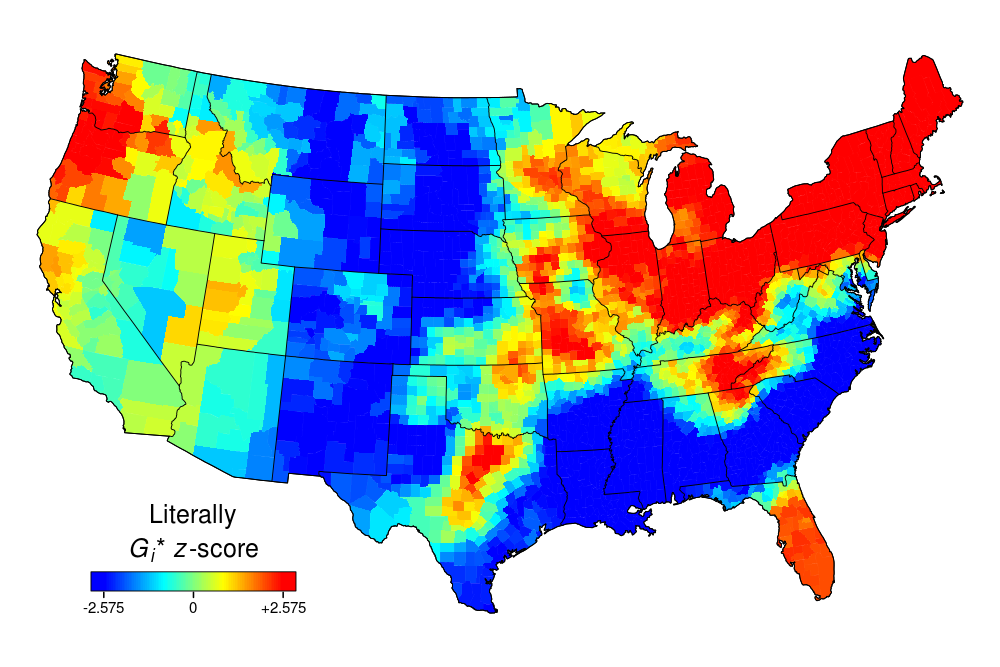
I mean, literally:
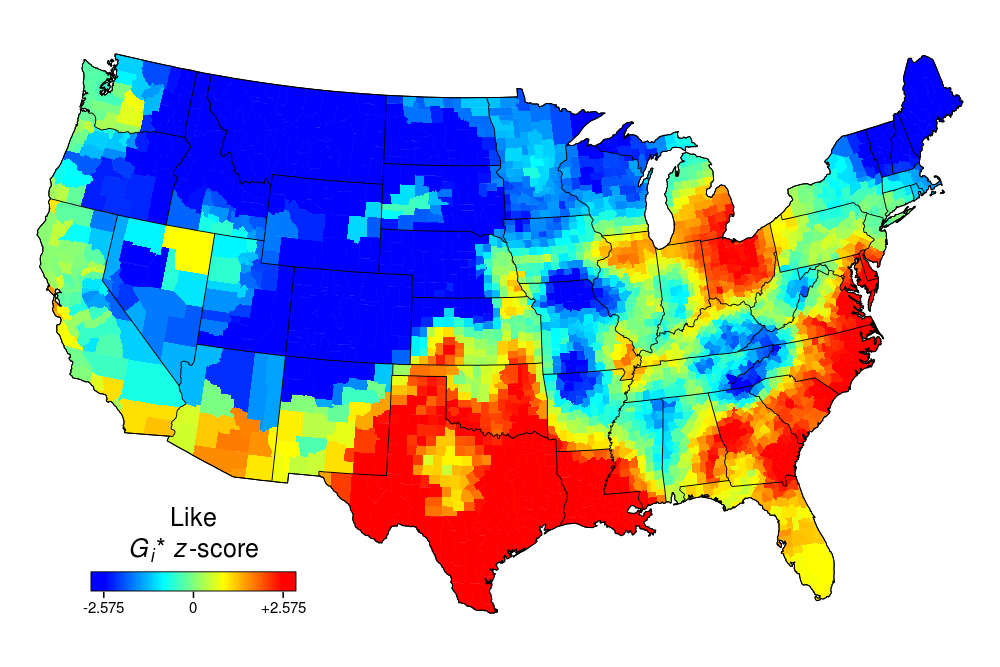
You know, like
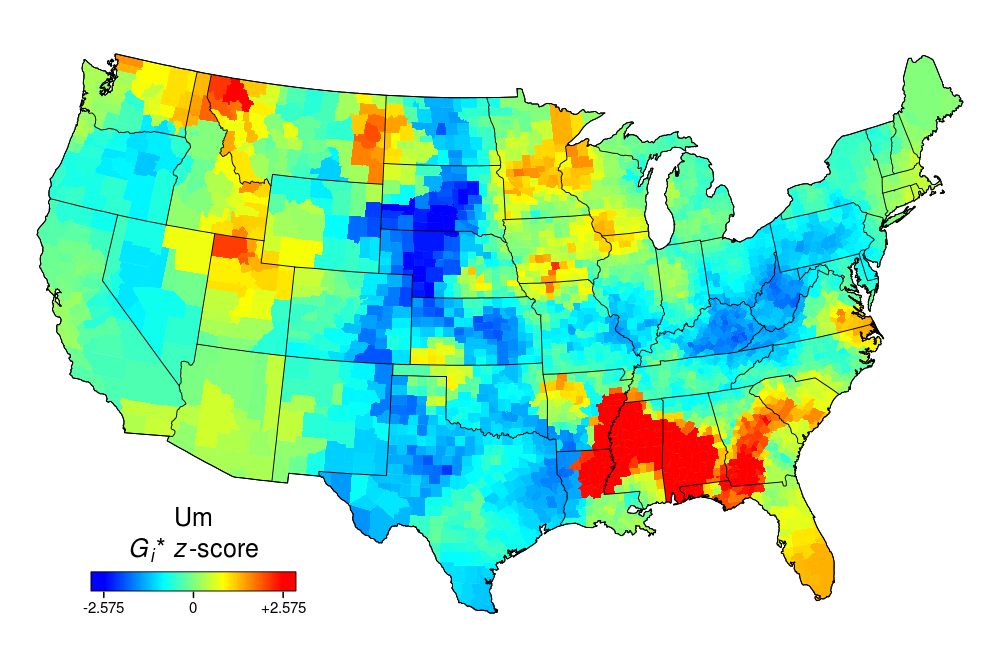
What does it mean? Um…
…it's obvious, right?
Two small criticisms —
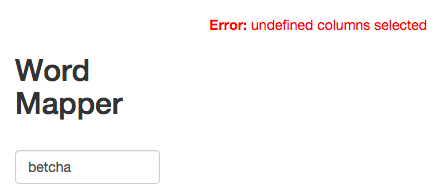
First, it seems that the underlying wordlist is somewhat prescriptive as to spelling, so that things like "betcha" turn up as errors.
This is not because Twitter lacks betcha or similar items.
And second, it would be nice to be able to map common ngrams! I mean, as long as you're giving out free ice cream, why not offer chocolate syrup as well?
And you could offer animated maps showing changes over space and time!
Twitter should immediately give Jack all its historical data and a few racks full of servers to implement and offer those features. And world-wide coverage! And sums and ratios and …
Bathrobe said,
January 29, 2016 @ 3:48 pm
Couldn't coverage be extended to Canada?
D.O. said,
January 29, 2016 @ 4:47 pm
Is there a reason why Alaska and Hawaii seceded? They didn't like like?
Rubrick said,
January 29, 2016 @ 4:55 pm
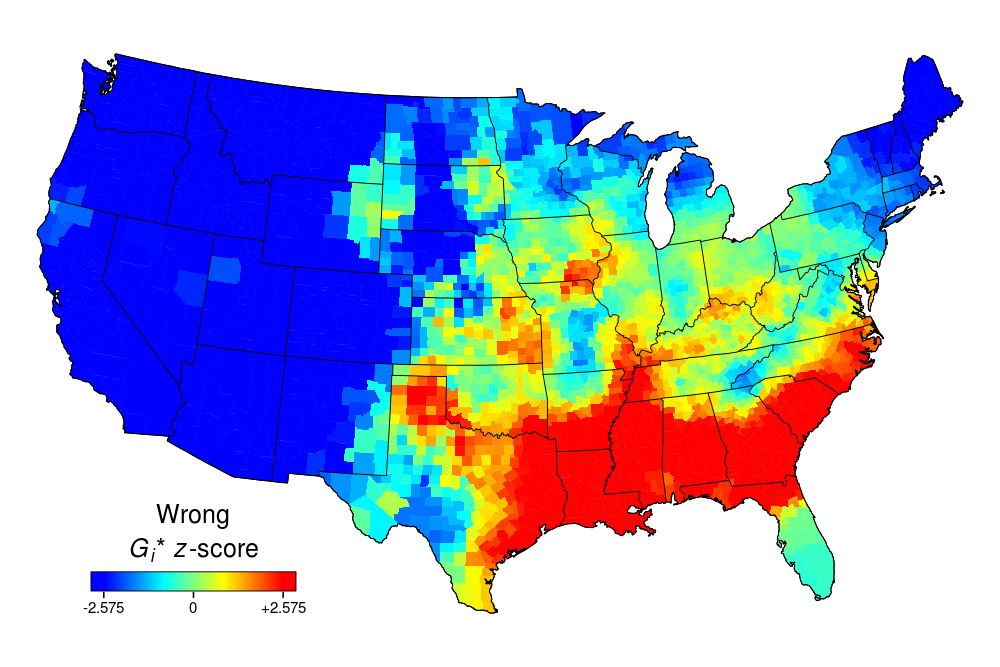
I can get myself to a "well, that kinda makes sense" rationalization for most of these based on vague demographic stereotypes, but the very strong skew of "wrong" towards the Deep South has me stumped.
David L said,
January 29, 2016 @ 6:37 pm
@Rubrick: maybe southern tweeters spend a lot of time telling northern tweeters they're using 'literally' wrong.
James Flynn said,
January 29, 2016 @ 10:09 pm
How about 'THE' as a definite article? that would go well with your (Liberman) past posts. I tried 'in which' and got nothing so we'll see.
Chas Belov said,
January 30, 2016 @ 3:30 am
It doesn't like "yinz" either, and I'm definitely finding that on Twitter.
Chas Belov said,
January 30, 2016 @ 3:31 am
For that matter, it doesn't like "fizz".
Jack Grieve said,
January 30, 2016 @ 3:40 am
Thanks again for posting this, Mark!
It should map any string of alphabetic characters plus hyphens (but you have to replace the hyphen with a period) that are in the top 10,000 words in the corpus. So I guess 'betcha' just didn't make the cut, which is surprising. We've got data offline for over 100,000 words though.
No multi-word units though unfortunately. That will take a fair bit of computational power, but we will get to it at some point.
In addition to setting up Wordmapper GB and Wordmapper Ireland (sorry no data for Canada yet), our main desiderata, like Mark foresees, are to allow for map mathematics (e.g. [Pail/(Pail+Bucket)] or [all – all the]).
D.O. said,
January 30, 2016 @ 12:15 pm
Map mathematics should make for an interesting problem though. Because (say I without reading the paper) there is a lot of smoothing going on, [Pail/(Pail+Bucket)] =/= [Pail]/[(Pail+Bucket)] and the question, of course, is what this difference is telling us.
D.O. said,
January 30, 2016 @ 12:20 pm
And, because Dr. Grieve reads this thread, is there any chance for age and gender specifications too? And education level or any other socioeconomic characteristic would be a huge plus too, but they seem to be implausible to ascertain.
Jack Grieve said,
January 30, 2016 @ 12:22 pm
I'm not sure I follow.
For me [Pail/(Pail+Bucket)] = [Pail]/[(Pail+Bucket)]
With smoothing, you would do it after the calculations not before.
So Smooth(Pail/(Pail+Bucket)), not Smooth(Pail)/Smooth(Pail + Bucket) or anything like that.
But maybe that is what you meant? I was just using square brackets to distinguish between the two formulas, not to indicate where smoothing would take place.
Jack Grieve said,
January 30, 2016 @ 12:28 pm
Age, gender and most important I think ethnicity are tricky, since Twitter doesn't provide that info.
One thing we did when we were looking at new words and wanted to see who was coining them was that we looked at the profile pictures of the users. But that is very labor intensive and a bit questionable I think, both technically and ethically.
You could use county level stats from the census bureau, but I think there is probably too much variability in those values, since counties can be quite large. But if you move down to the census tract level, then you get much more reliable stats. The problem then is that 10 billion words isn't nearly enough data, at least for most of the US (we've done some census tract mapping of NYC though).
But it's all just a matter of time. Like Mark said at his Methods plenary in Groningen a few years ago, it won't be long till we are getting access to much larger datasets of web-scraped language data (including speech) with unbelievably rich social information about users.
D.O. said,
January 30, 2016 @ 1:50 pm
Dr. Grieve, thank you for the reply and yes, you've got my meaning about averaging exactly as I intended. Should make for interesting comparisons.
J. W. Brewer said,
January 30, 2016 @ 3:30 pm
It is interesting to see that Southern California is not the locale of peak "totally" usage, at least presently, since back in the day markedly heavy use of "totally" was a stereotypical Valleygirlism. But that was 30+ years ago, so there's been plenty of time for things to shift around and it might be hazardous to infer from the present map that "totally" was used more heavily in Utah than Sherman Oaks way back then.
Elessorn said,
January 31, 2016 @ 1:06 pm
Fascinating. Also a bit weird. So "up" is especially popular in the Deep South. (I guess they say "up North" a lot?)
[(myl) Well, "down" is pretty much a Southern thing too:
]
James Wimberley said,
February 1, 2016 @ 9:26 am
A Spanish version for the USA, Mexico and Central Aneruca could shed light on the evolution of Latino speech.
Jack Grieve said,
February 1, 2016 @ 5:50 pm
The most basic pattern is that the North/East use more nominal/written forms, whereas the South/West use more verbal/conversational forms.
This is basically the geographic dimension of Biber (1988)'s dimension 1 (informational vs. involved), which has been reproduced across registers and language. I also find this same type of regional-functional pattern in my forthcoming book with CUP, which looks at regional variation in grammatical alternations in Letters to the Editor.
Anyway, thanks again for all the interest here at Language Log. The webapp is now offline, but we'll get a better permanent version up soon. We're just thinking about the best way to host it.
Jani said,
February 3, 2016 @ 11:12 am
It would be interesting to see how these change over time–and how certain expressions that are common in one area (such as "like" in Southern California) might be more popular in another area 20 or 30 years later.