Against physics
« previous post | next post »
Or rather: Against the simplistic interpretation of physics-based abstractions as equal to more complex properties of the physical universe. And narrowing the focus further, it's a big mistake to analyze signals in terms of such abstractions, while pretending that we're analyzing the processes creating those signals, or our perceptions of those signals and processes. This happens in many ways in many disciplines, but it's especially problematic in speech research.
The subject of today's post is one particular example, namely the use of "Harmonic to Noise Ratio" (HNR) as a measure of hoarseness and such-like aspects of voice quality. Very similar issues arise with all other acoustic measures of speech signals.
I'm not opposed to the use of such measures. I use them myself in research all the time. But there can be serious problems, and it's easy for things to go badly off the rails. For example, HNR can be strongly affected by background noise, room acoustics, microphone frequency response, microphone placement, and so on. This might just add noise to your data. But if different subject groups are recorded in different places or different ways, you might get serious artefacts.
OK, what's HNR? To illustrate the idea, let's start with an illustration of what perfect periodicity looks like in the time and frequency domains, and how we separate … Or well, never mind, maybe that's too complicated.
Instead, let's just play a few seconds of a perfectly periodic sawtooth wave (or at least as perfectly periodic as we can make it, in a digitally-sampled format with limited-precision samples):
And now a few seconds of white noise, at 1/5 the level:
And the two of them added up:
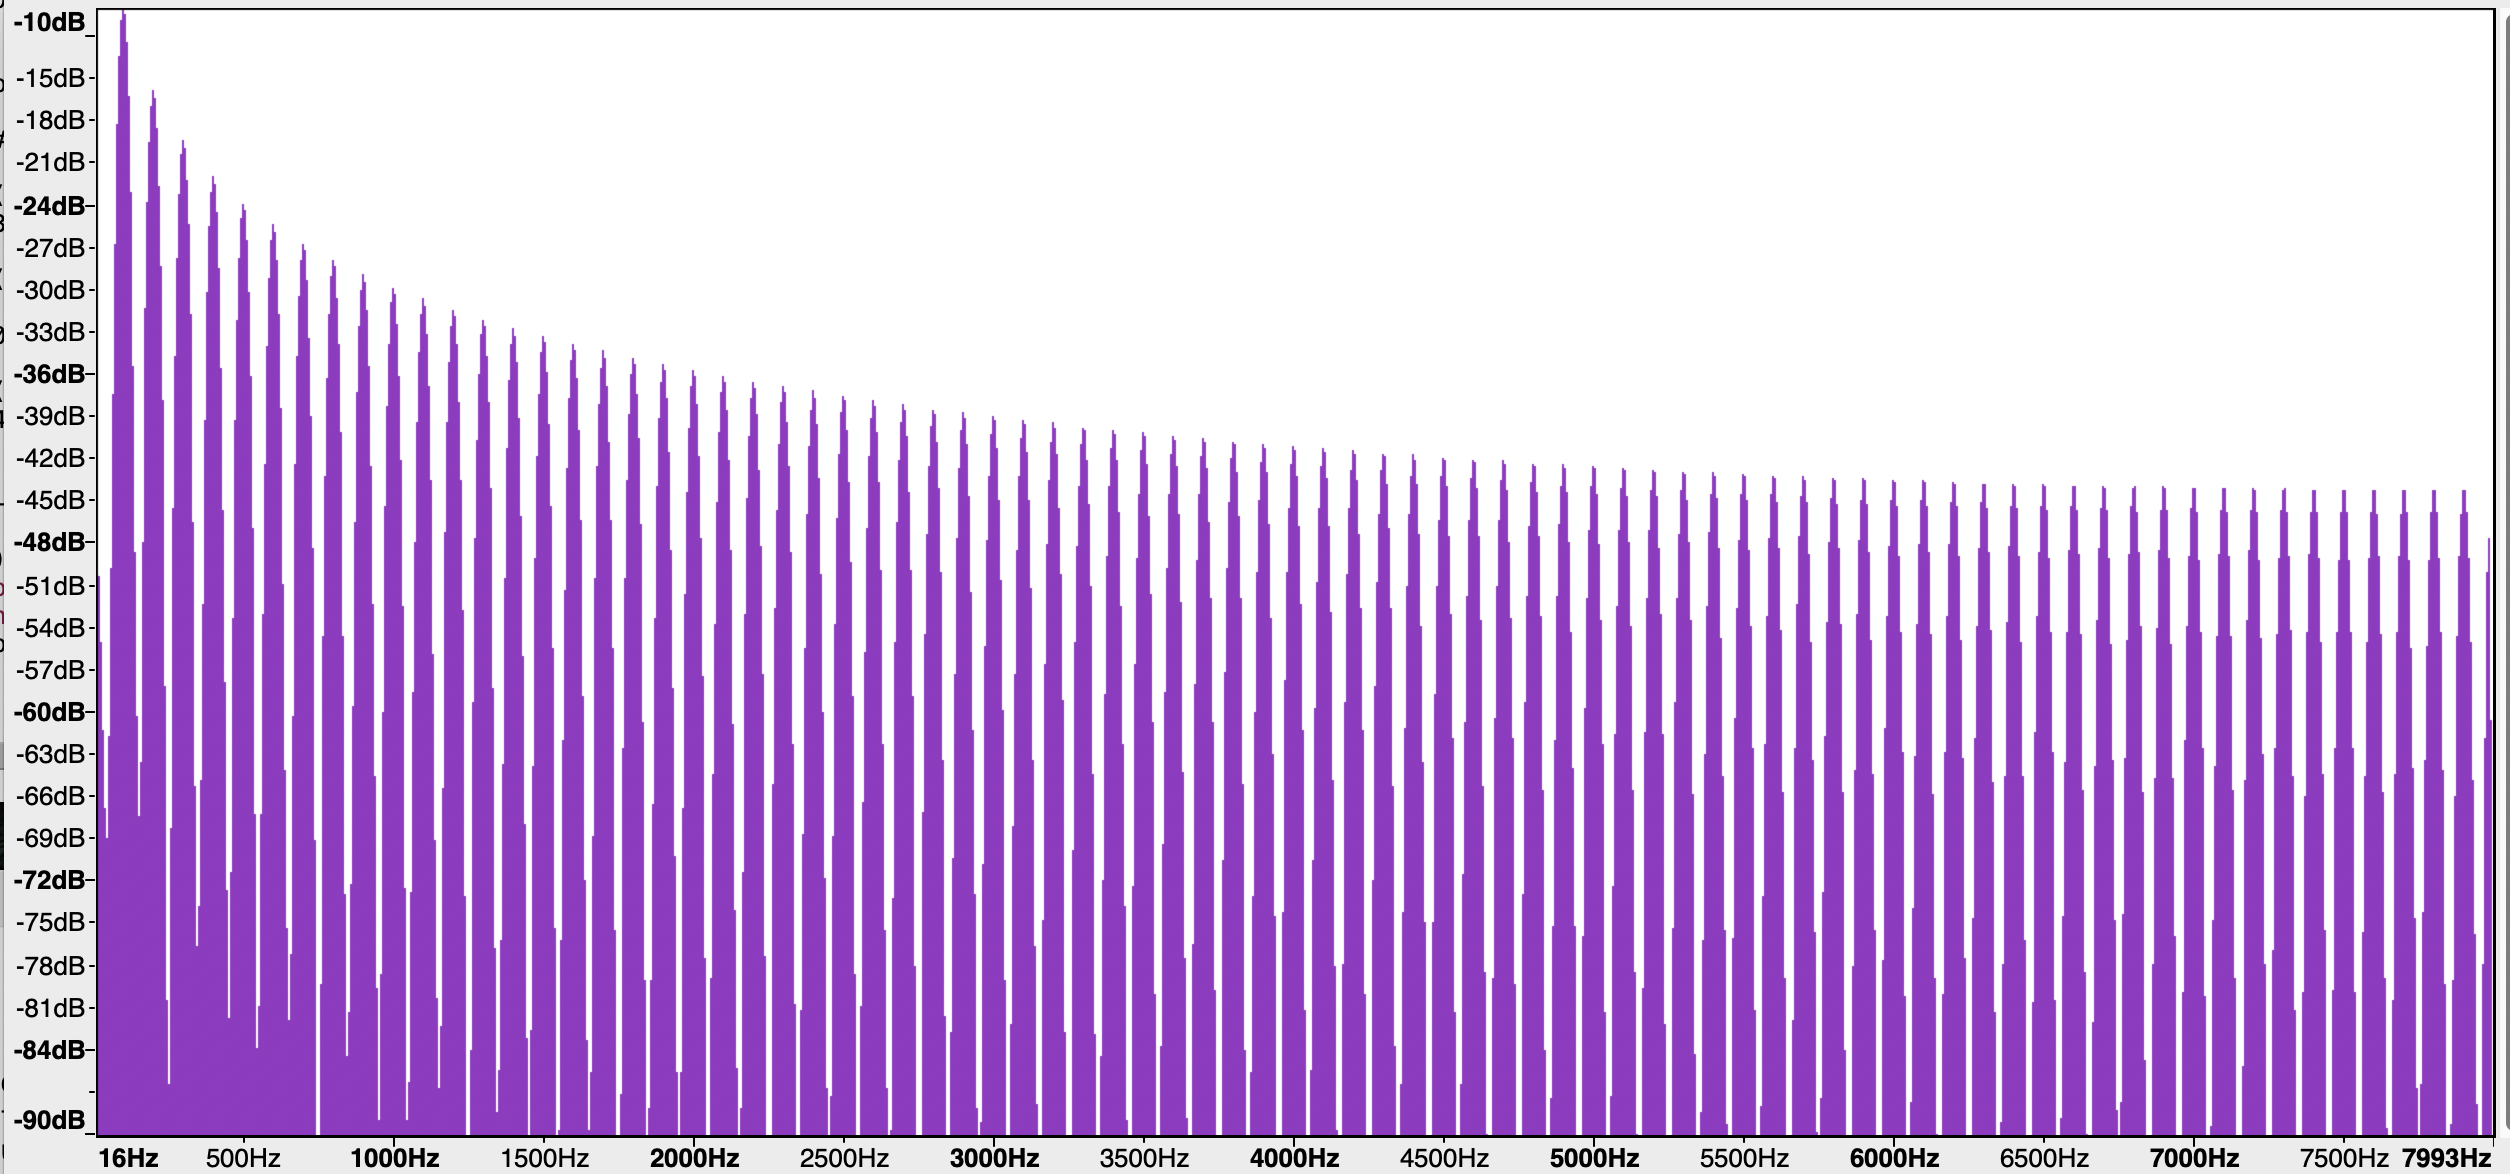
Here's what the log power spectrum of the buzz looks like — as you can see, it's basically just harmonics (i.e. regularly spaced frequency components), no visible noise:
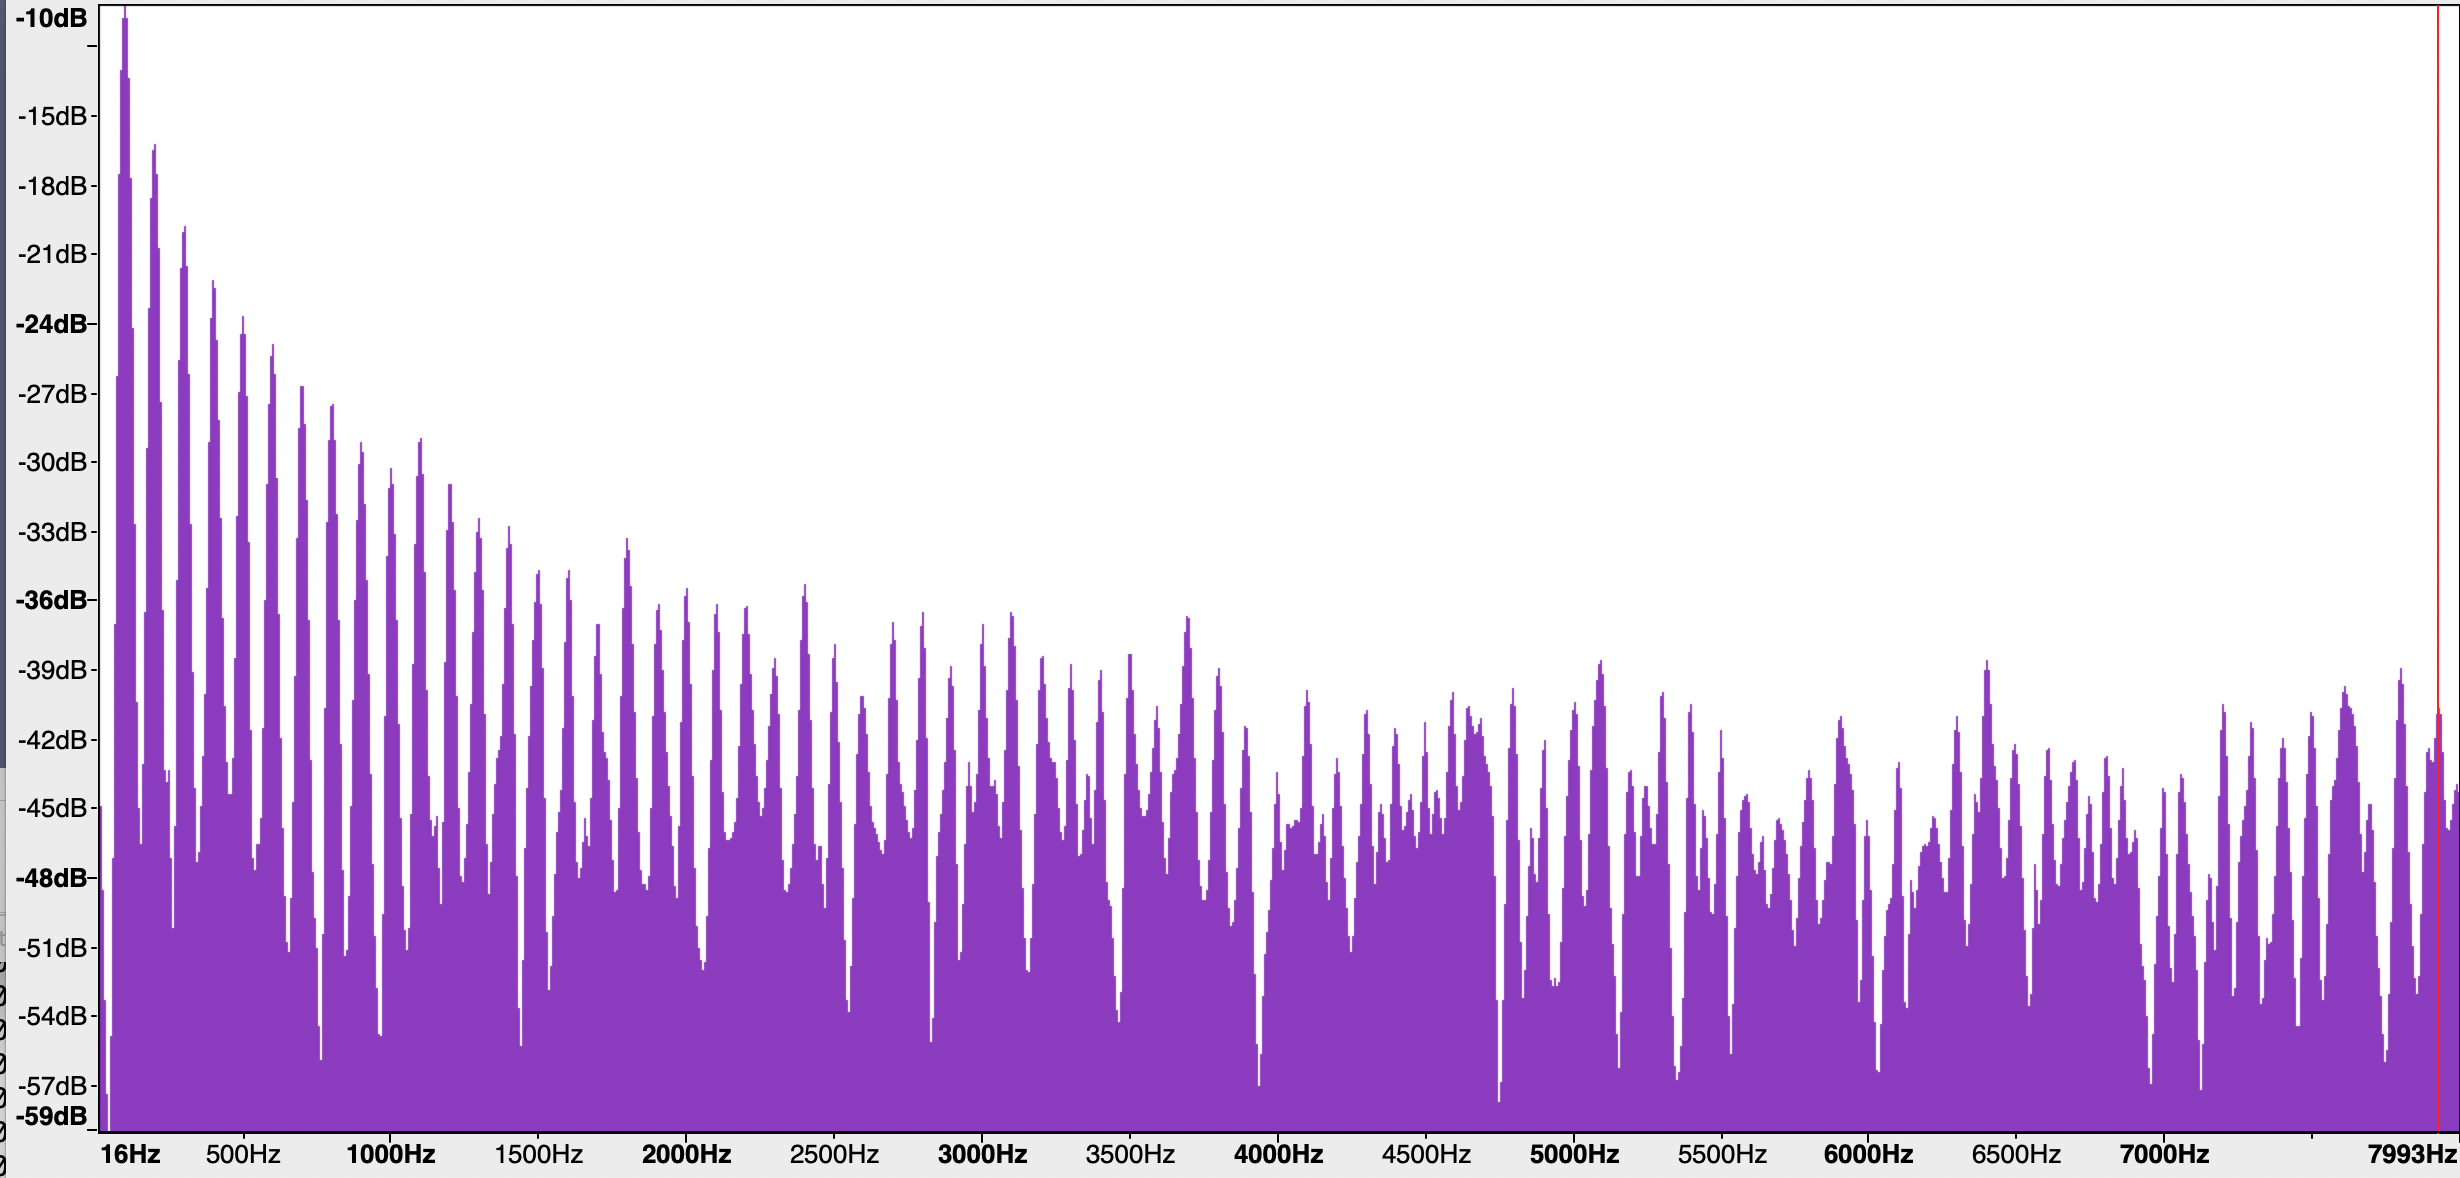
And here's the same thing for the buzz+hiss — and now we clearly see the noise along with the harmonics:
If we add a louder hiss to the buzz, we get this sound:
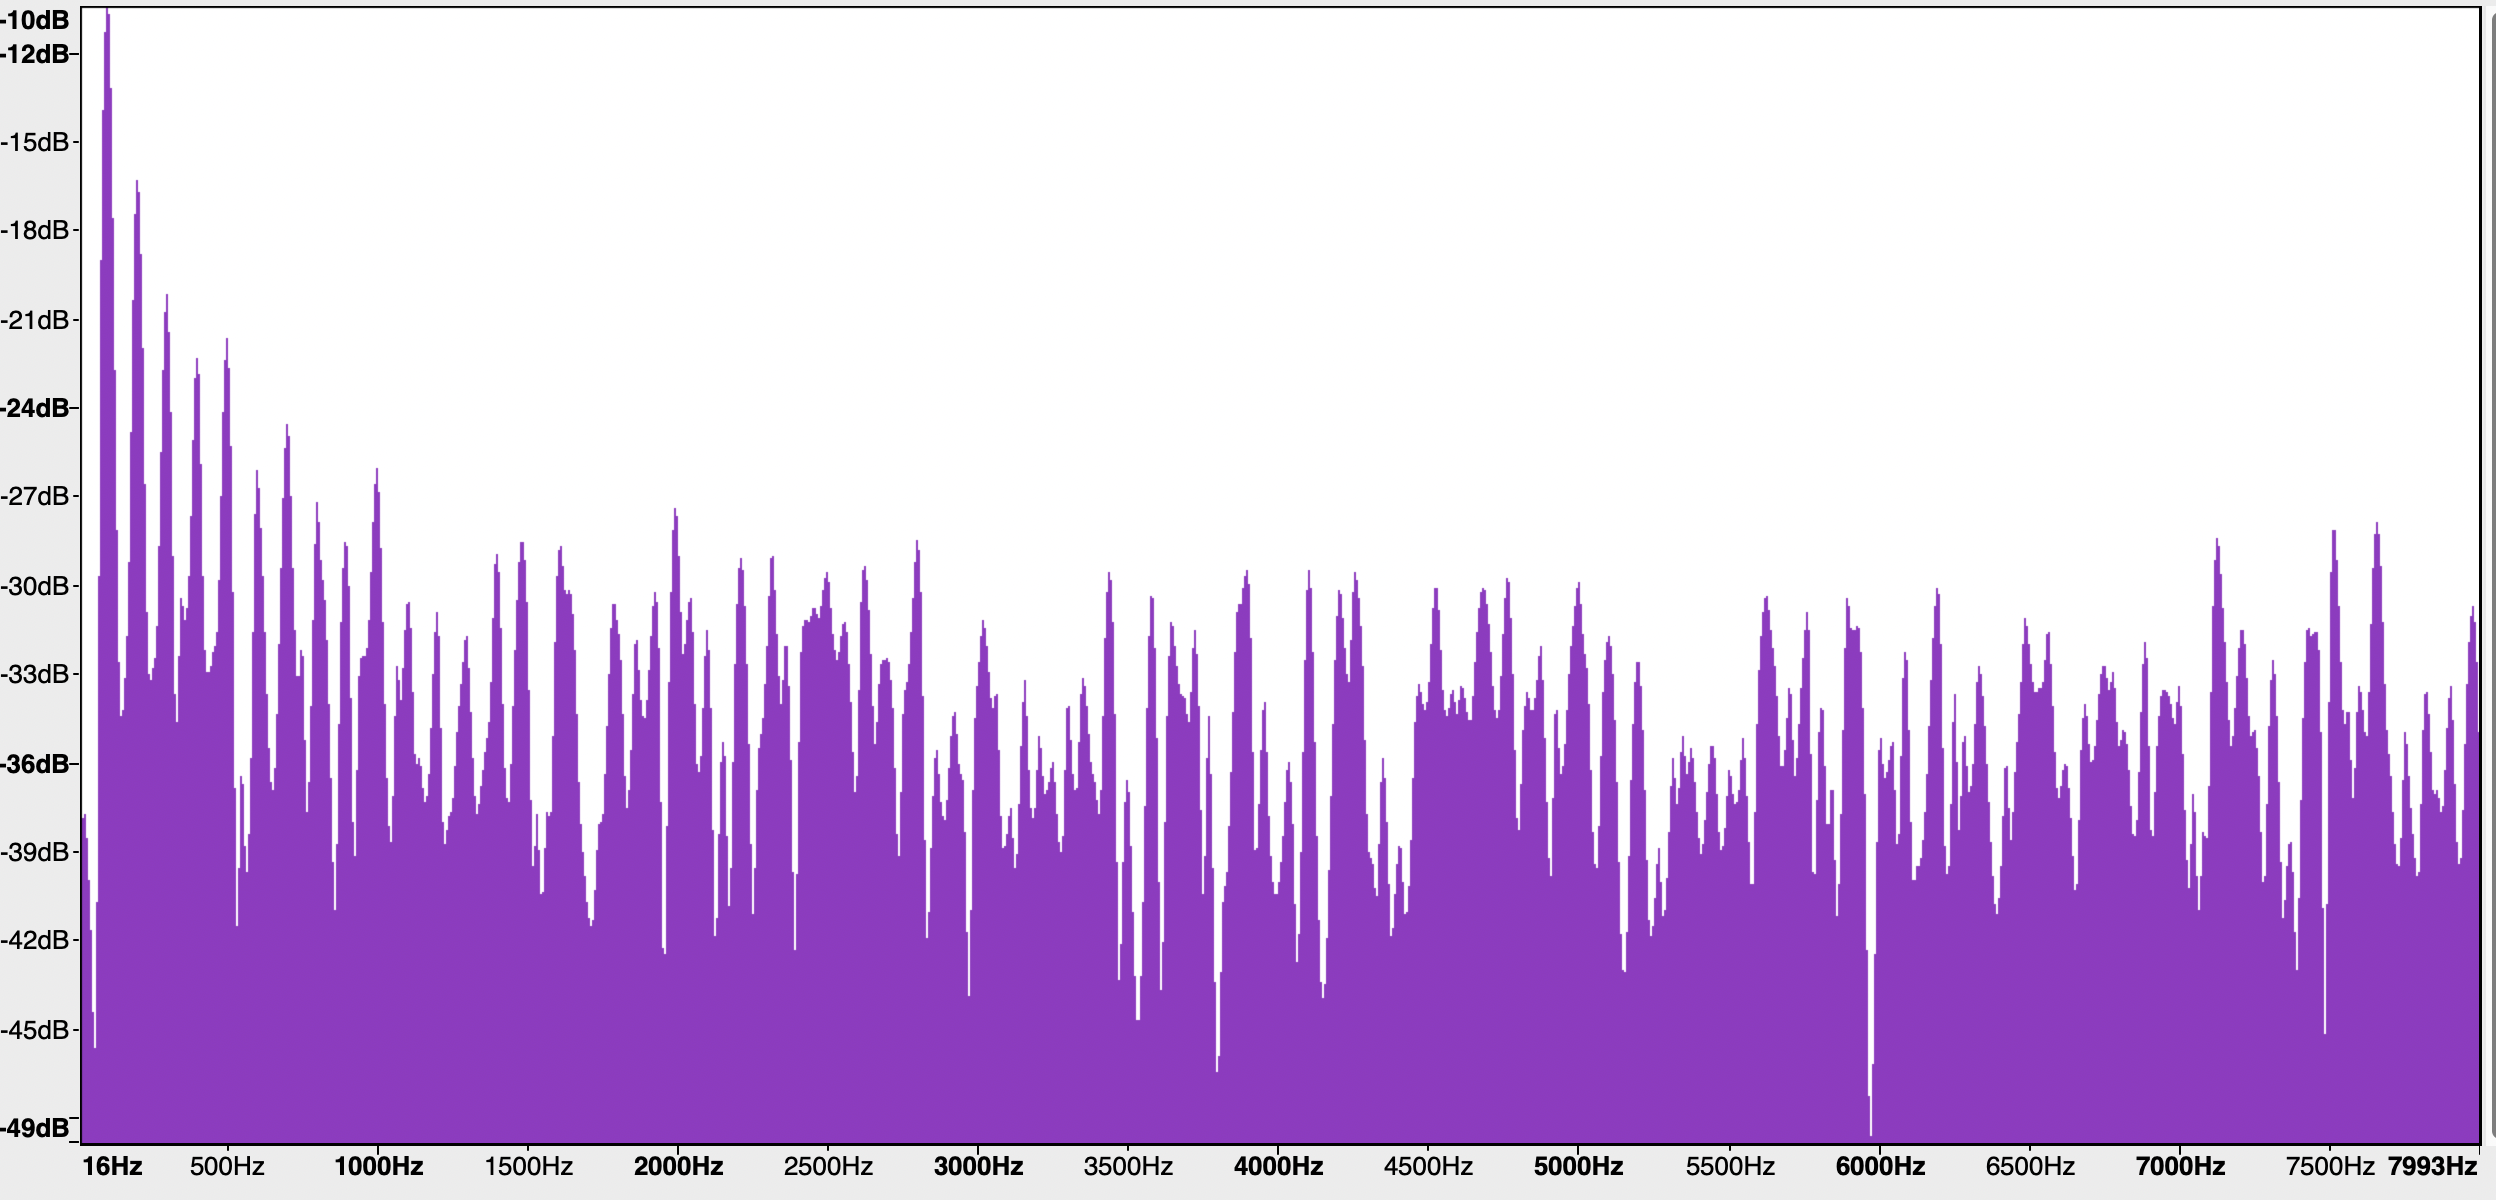
…and this spectrum, in which our eyes show us the even-higher noise floor:
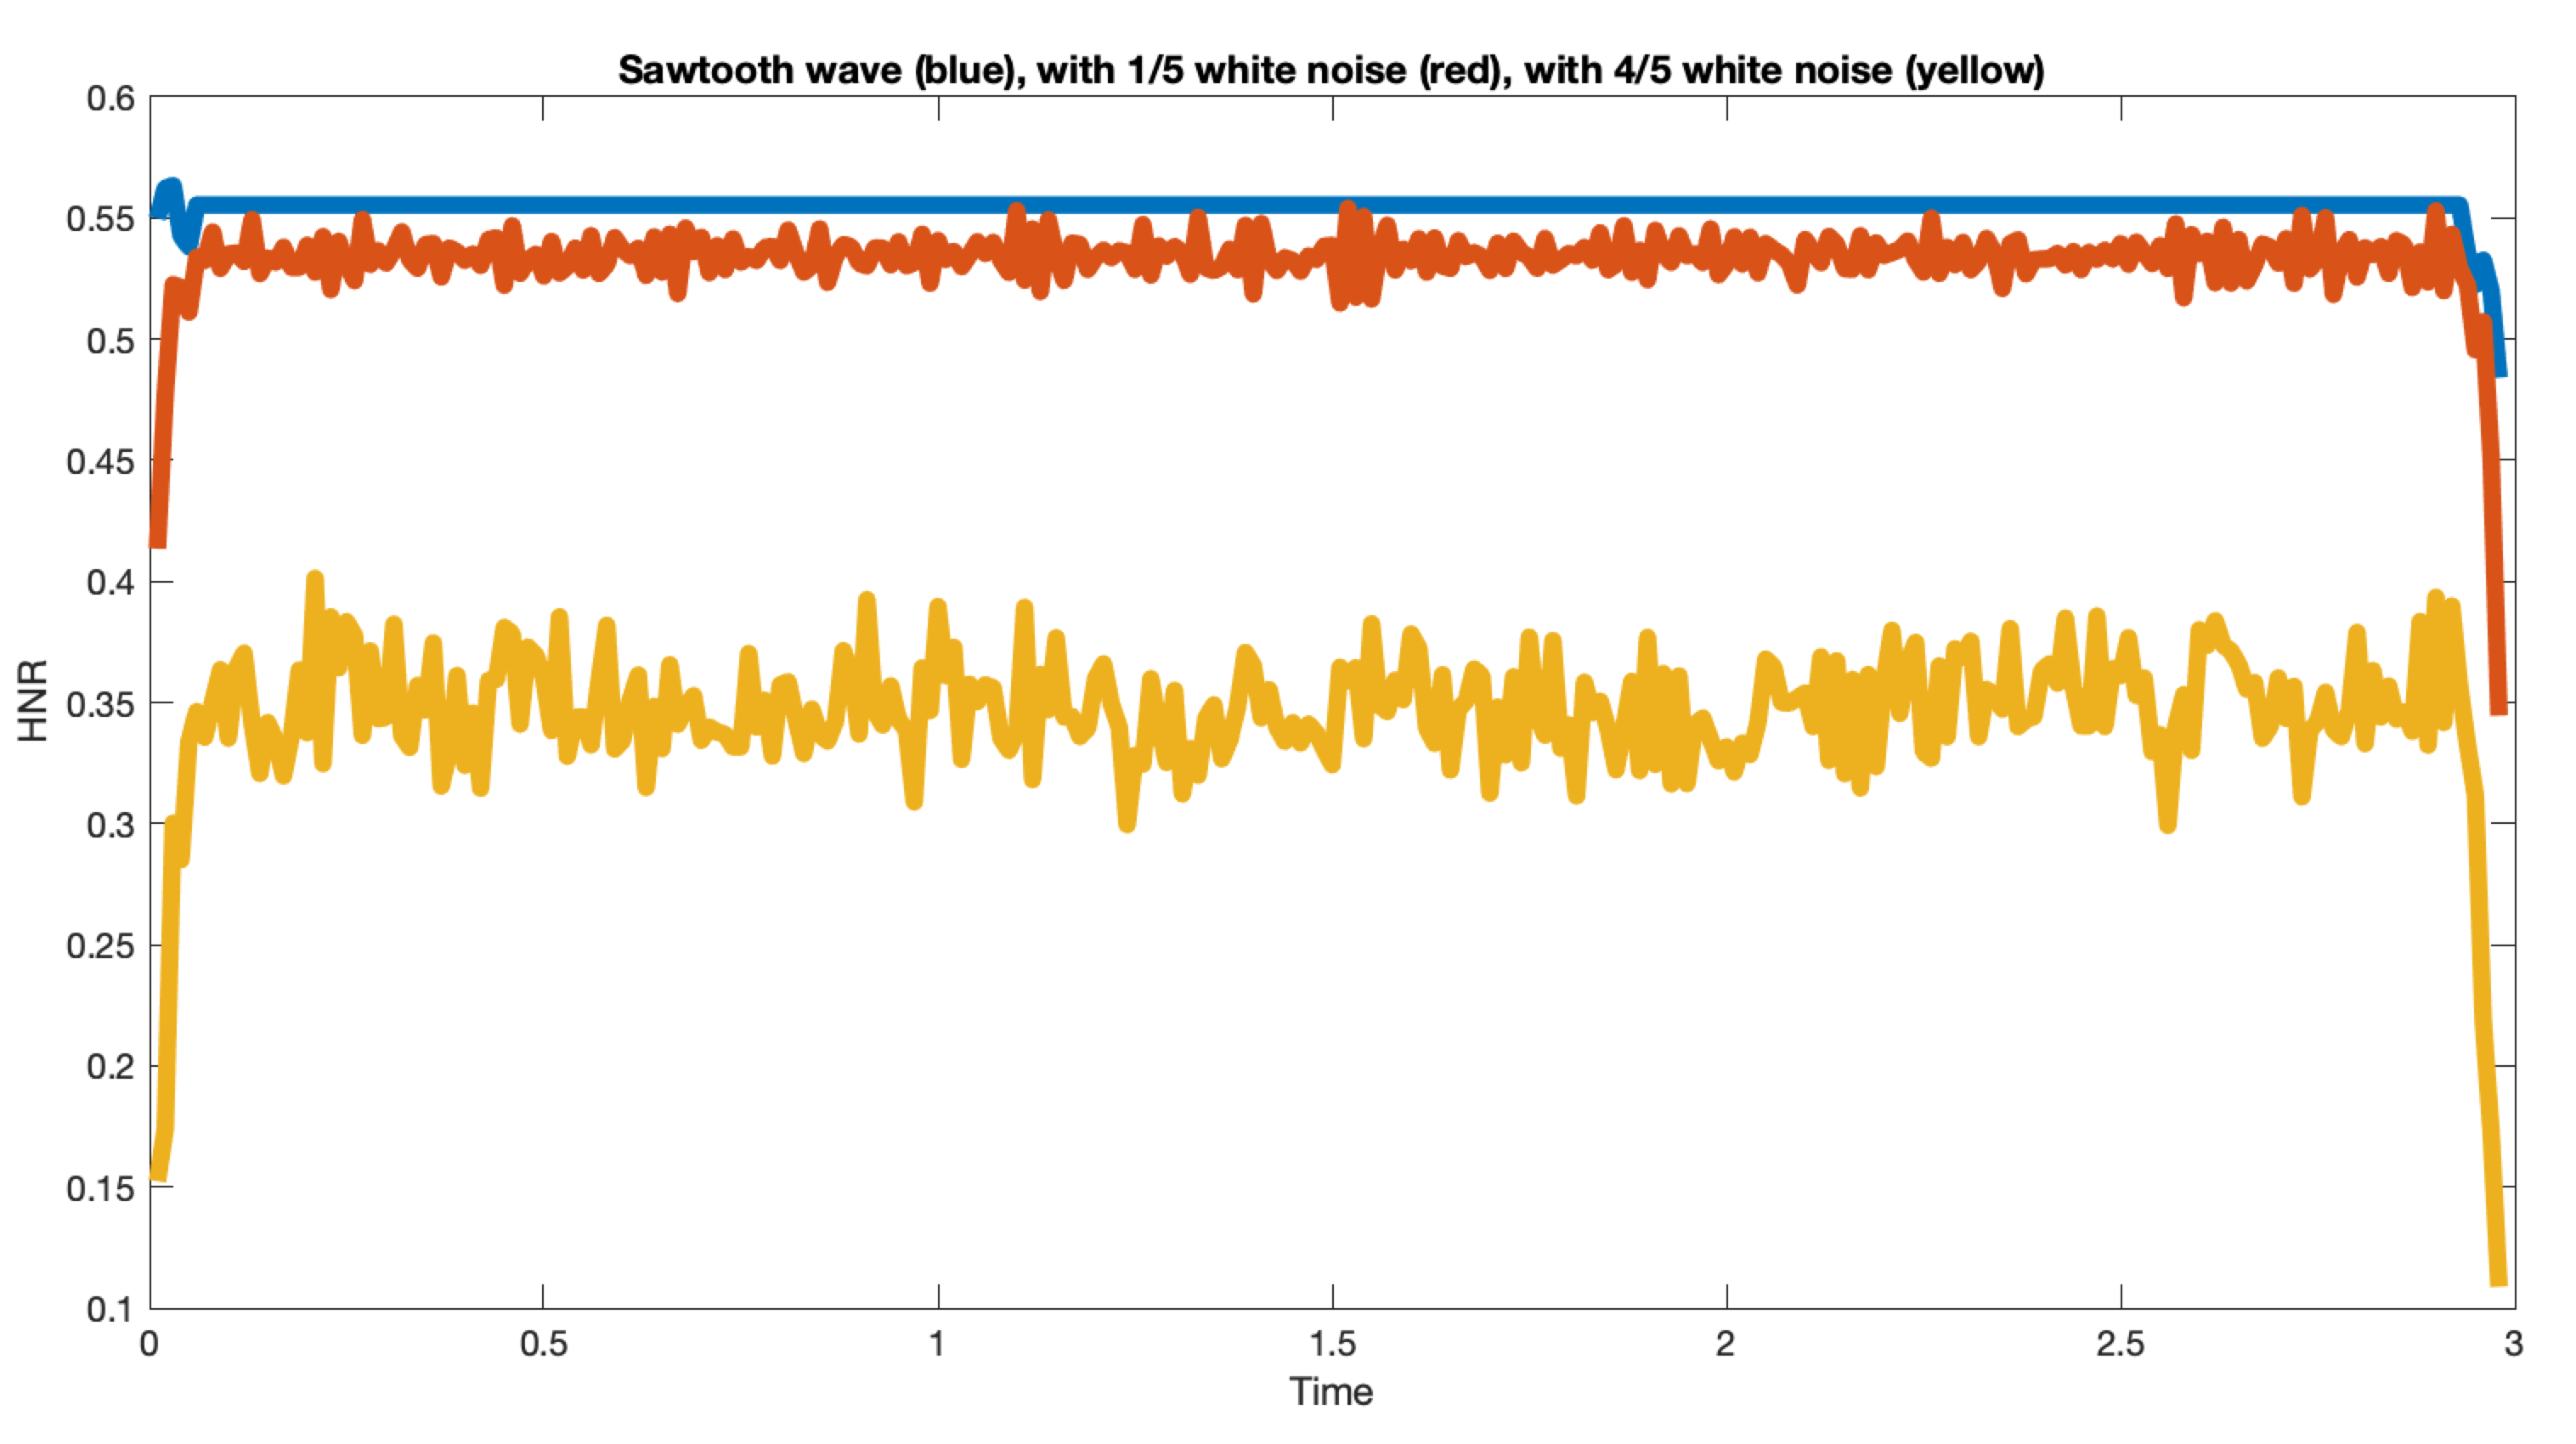
There are several methods for quantifying the "harmonic to noise ratio", and many choices for each method, but any plausible choice will give results that echo what our ears and eyes tell us about these synthetic examples. Here's what Matlab's harmonicRatio() function does with them:
Never mind for now the mystery of why the different versions of those three signals have the particular HNR values they do — if we used a different algorithm, or made different choices for this one, we'd get different numbers anyhow (see the discussion here for the results of some alternative choices). The point is that we can quantify HNR in a way that accords with our ears and eyes — in this case.
Hooray!
But you can probably already see the troubles that are looming around the corner. When we start recording real-world sounds, we're going to go through some things
The issue starts with the whole "fundamental frequency" scam, which is based on the false idea that the "pitch" of the voice (and other quasi-periodic signals that we hear as pitched) should be interpreted by reference to the basic period (and therefore the frequency) of a perfectly-periodic signal. There are at least three difficulties with this idea.
First, real-world pitches are constantly changing, so we need to base our estimates on local regions — and the answer we get, for HNR and other periodicity-related measures, depends on the placement and sizes of the chosen regions.
Second, complex real-world oscillations, even from a single physical source, often have multiple simultaneous modes, perhaps involving period-doubling but also sometimes involving other components. As examples, see the many YouTube demos of polyphonic singing or trombone chords, etc. The definition of "harmonics" in such cases gets complicated — see Wilden et al., "Subharmonics, biphonation, and deterministic chaos in mammal vocalization", Bioacoustics 1998.
And third, real-world recordings generally contain sounds from more than one source, reverberation and other effects of room acoustics, consequences of microphone choice and placement, and so on. And even small differences in those characteristics can have a significant effect on acoustic measure in general, and HNR values in particular.
As a first example, let's look at one (of 6300) recorded sentences from the classic TIMIT corpus. As the 1990 documentation explains,
Recordings were made in a noise-isolated recording booth at TI, using a semi-automatic computer system (STEROIDS) to control the presentation of prompts to the speaker and the recording. Two-channel recordings were made using a Sennheiser HMD 414 headset-mounted microphone and a Brüel & Kjaer 1/2" far-field pressure microphone.
Here's the first sentence in the dataset, by alphabetical order — SA1 from speaker FADG0 (of 630) as recorded by the head-mounted microphone:
And here's the same sentence (literally the same audio event) as simultaneously recorded by the Brüel & Kjaer (which the creators called the "far field" microphone, though it wasn't physically very far away):
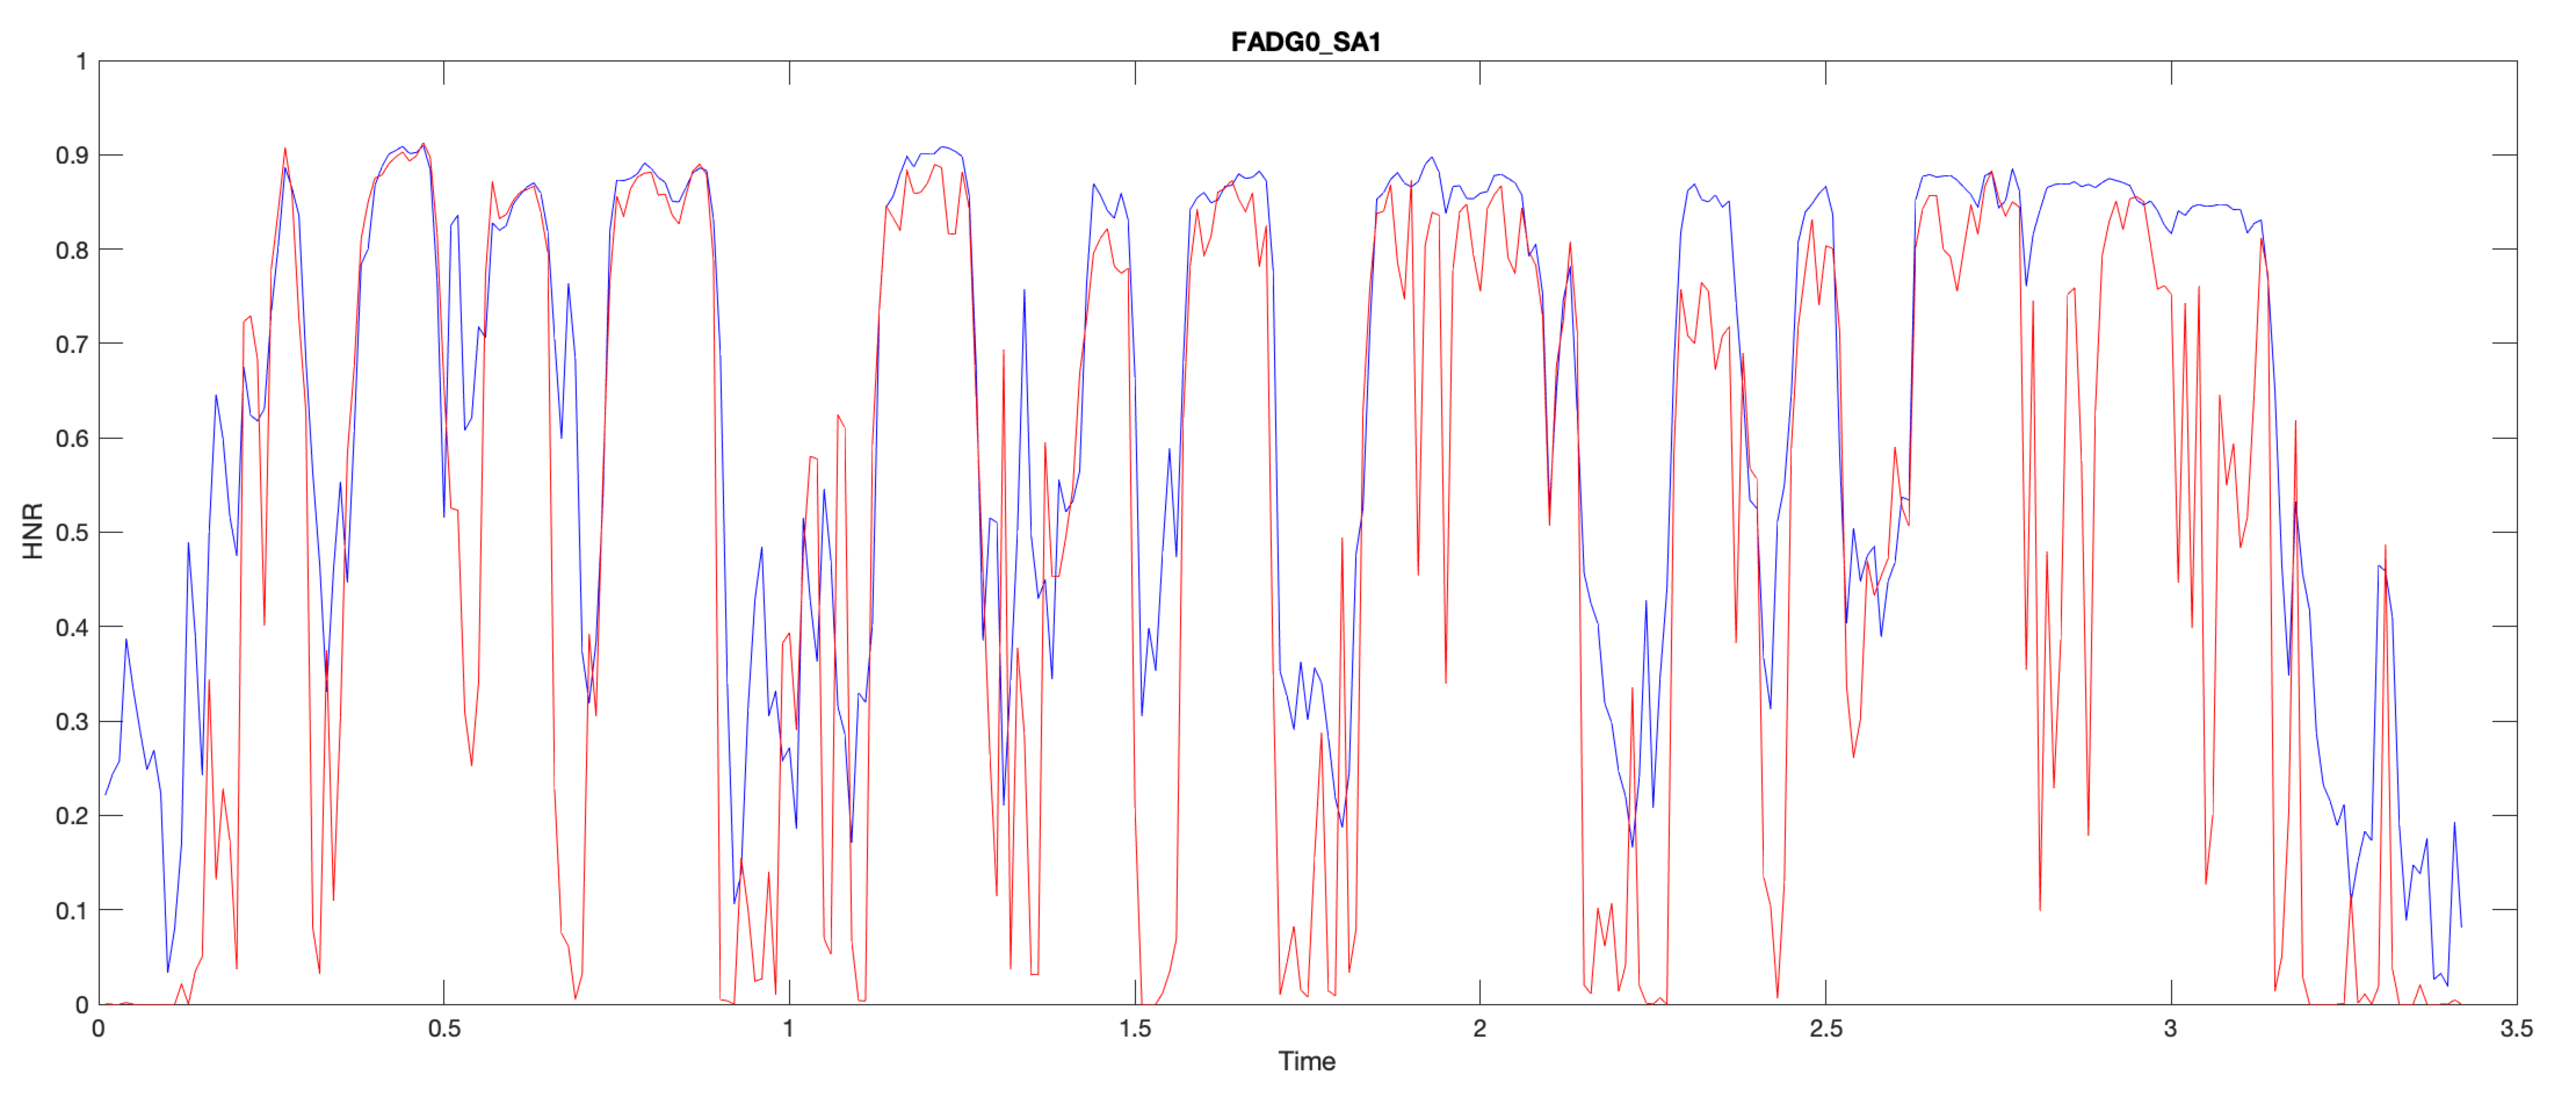
They don't sound very different, and both are higher in quality than typical sociolinguistic, clinical, or political recordings are. And yet the frame-wise HNR traces for those two recordings are quite different (though obviously correlated). In the plot below, the head-mounted microphone's time function is in blue, and the far-field microphone's trace is in red:
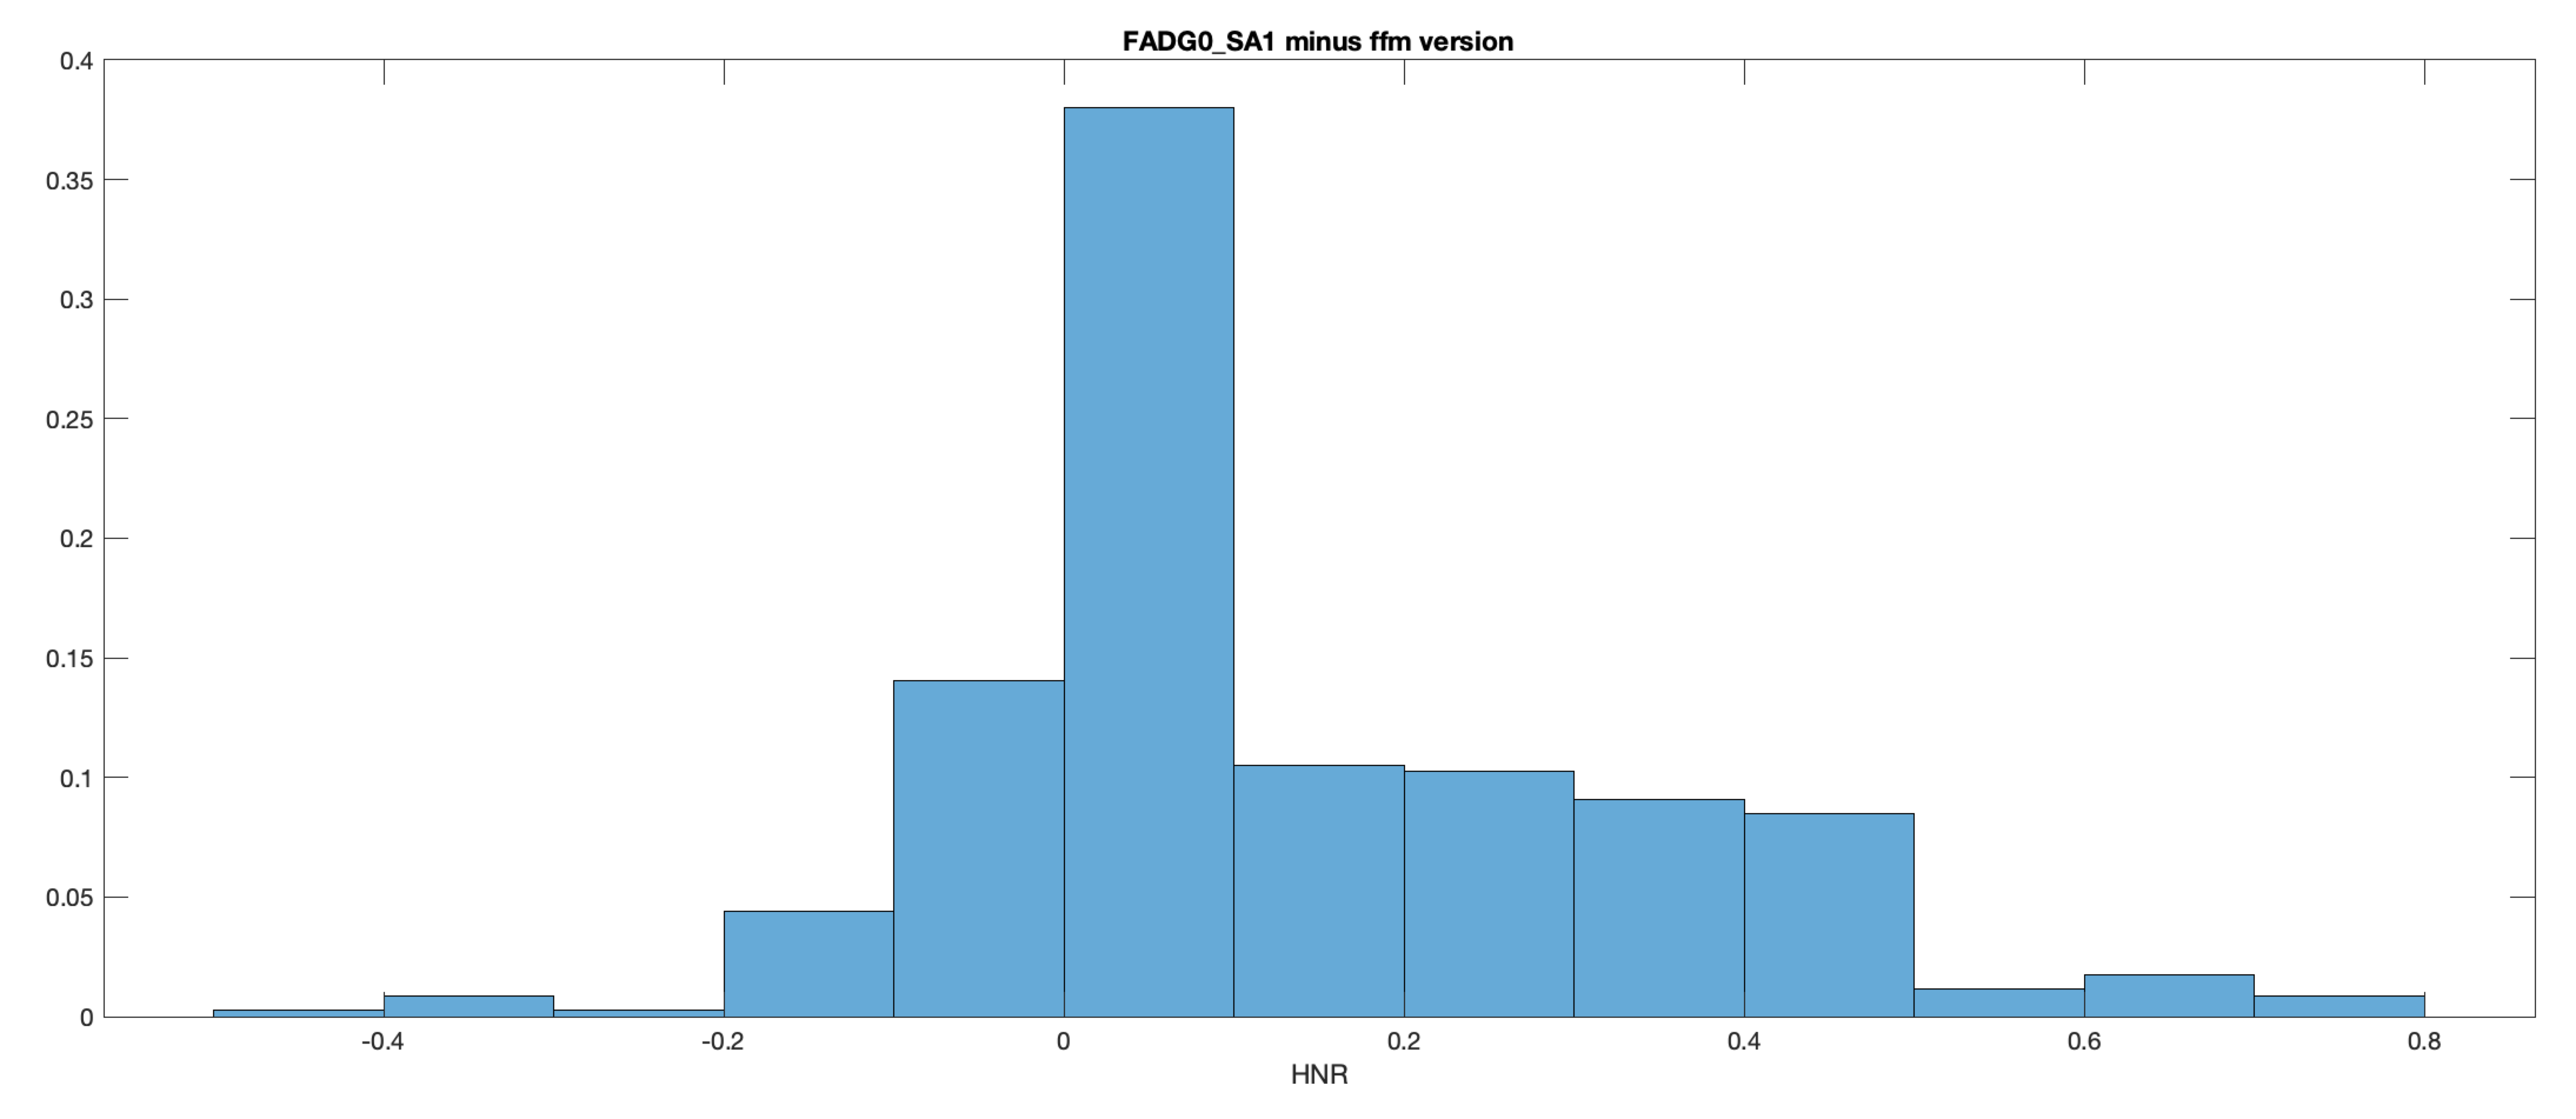
Here's a histogram of the frame-wise differences — note that the possible range of values is -1 to 1:
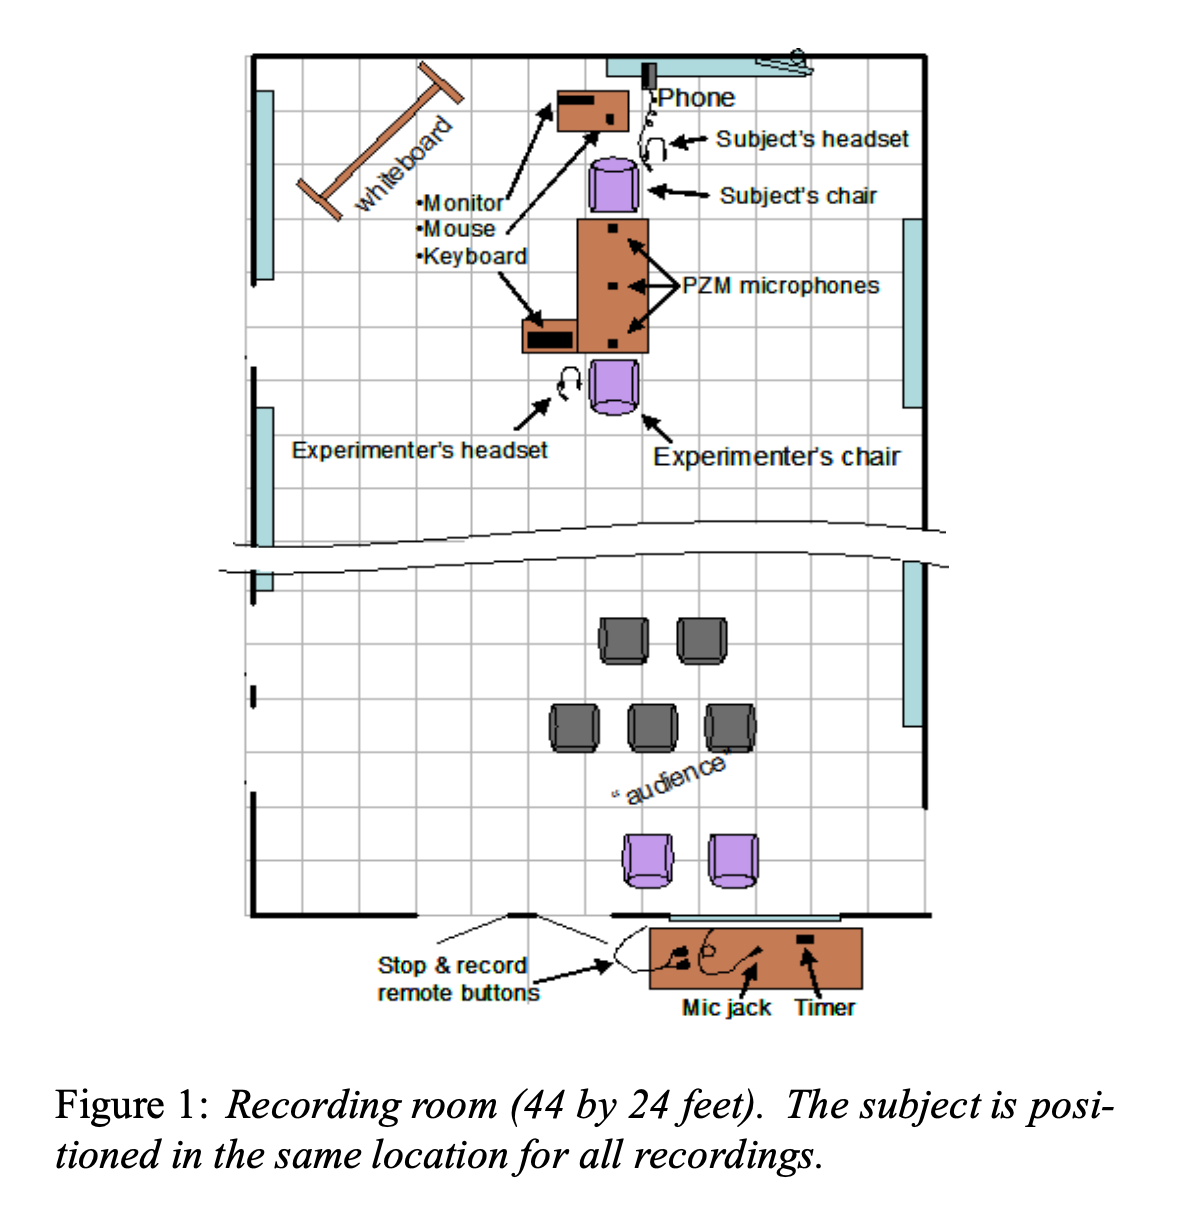
We can do a similar test with recordings from a dataset recoded about 15 years ago at SRI and MITRE, and documented in Shriberg et al., "Effects of vocal effort and speaking style on text-independent speaker verification", ISCA 2008. In this collections, published in 2017 and generally known as SRI-FRTIV, 34 speakers each perform at three different levels of effort (low, normal and high) in four different styles (interview, conversation, reading and oration), recorded by five microphones. The microphones were placed as shown in the diagram below:
Here's a three-second sample from two microphones of a bit of one subject's "normal"-level reading — again this is the first item in order, namely reading "a" from subject "001':
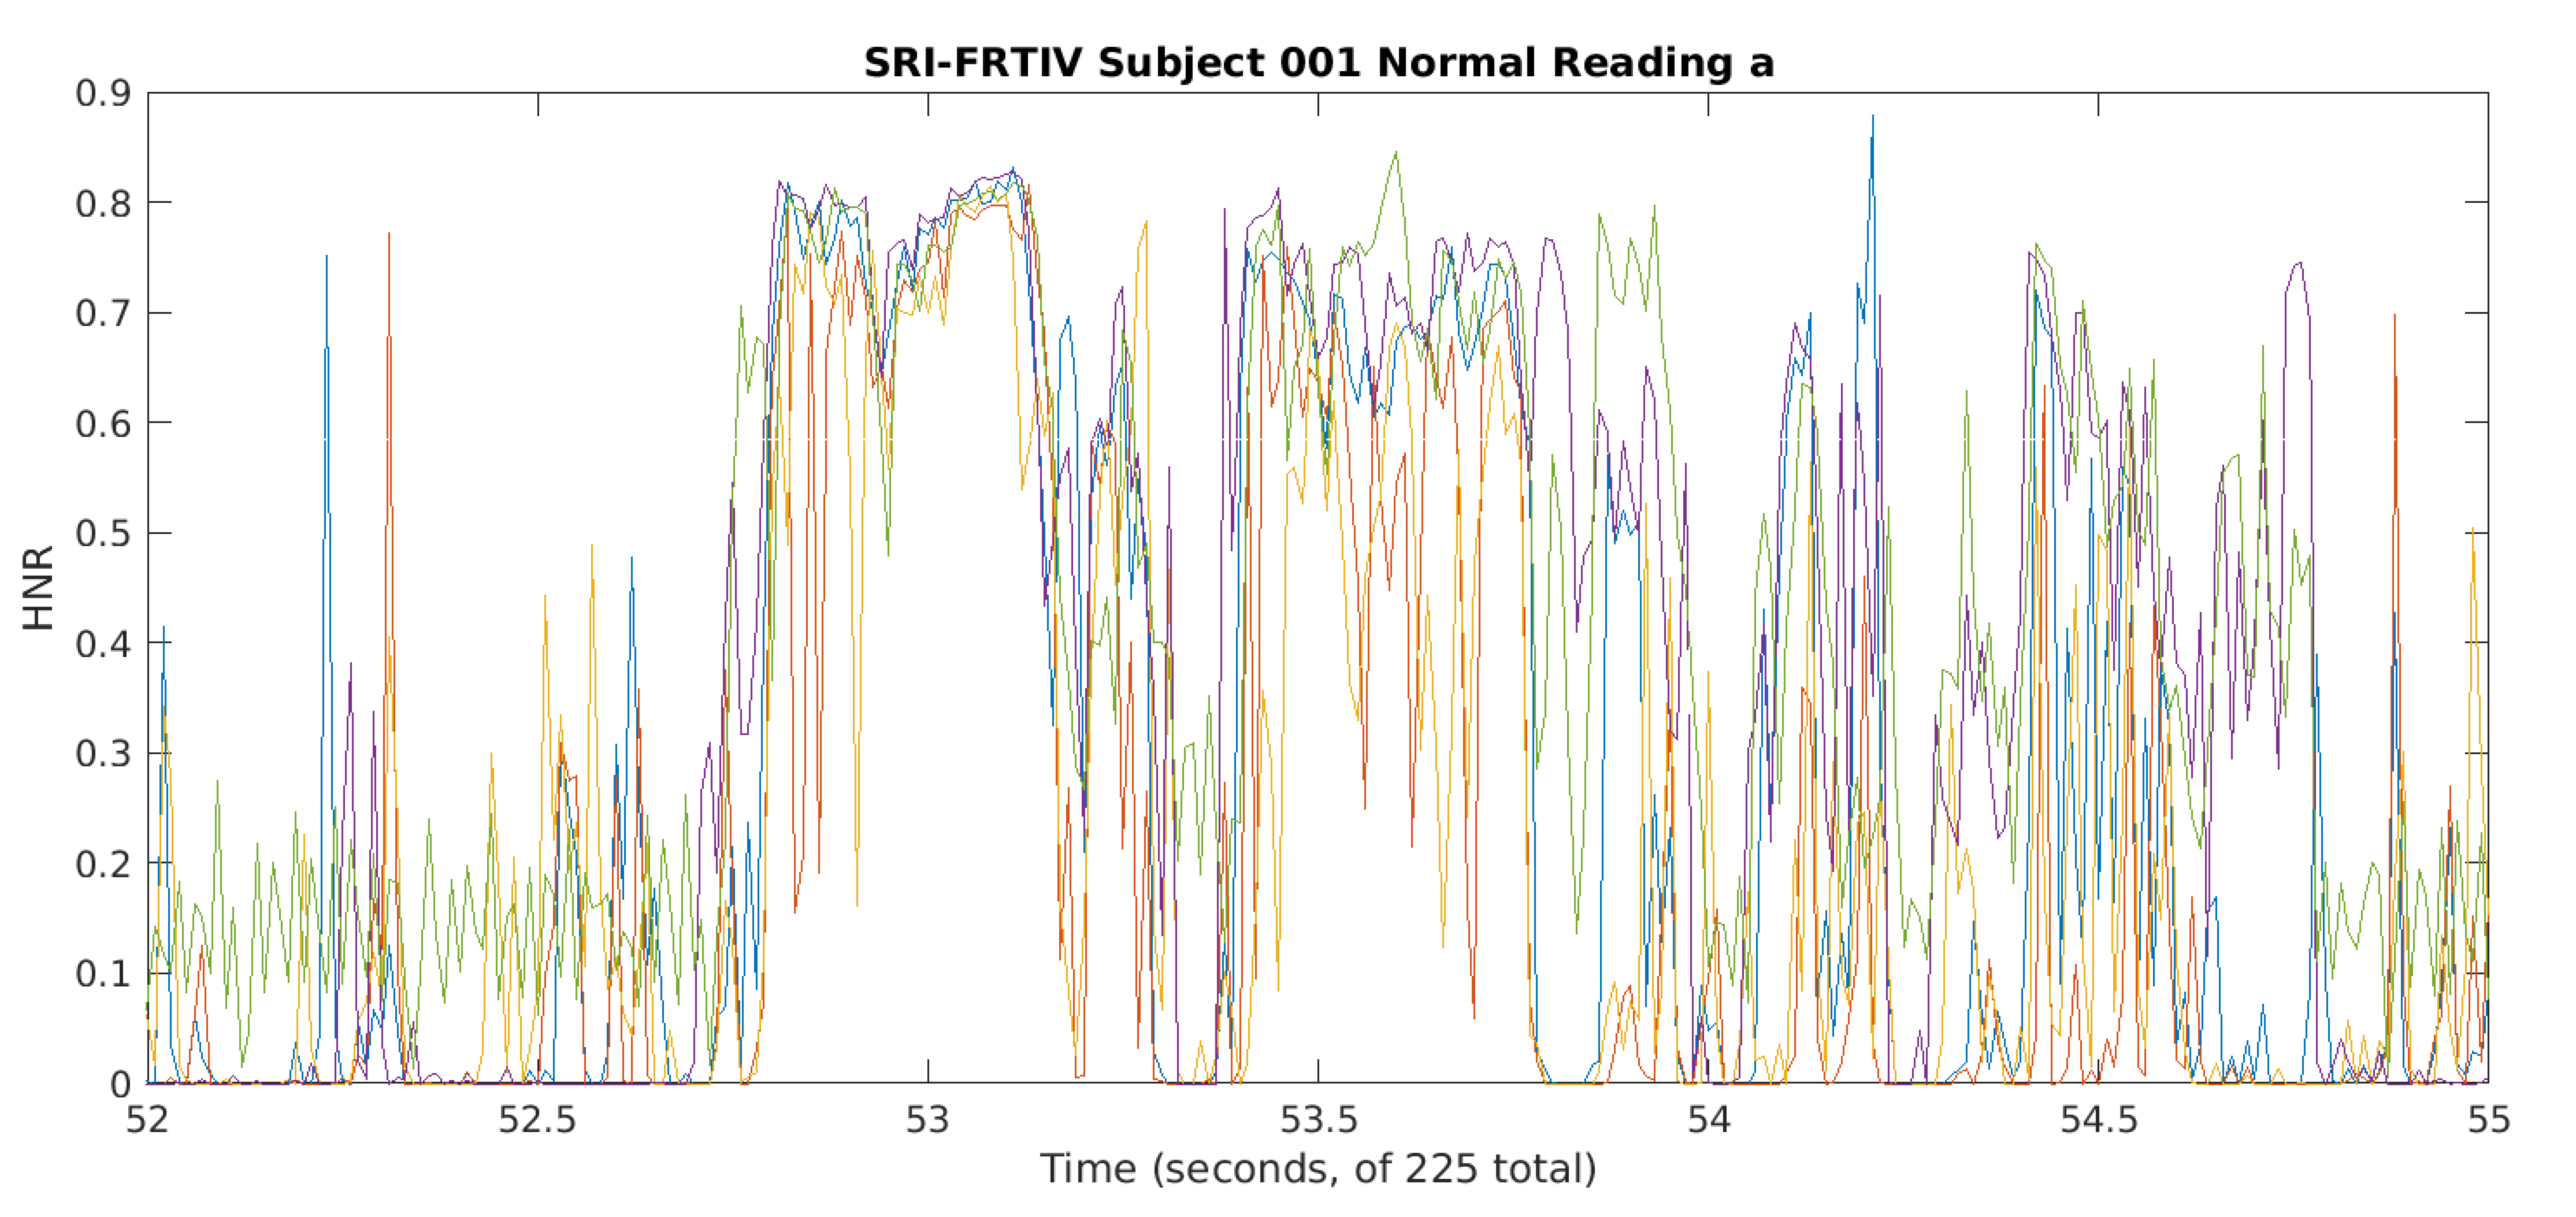
And here's the HNR time-function for that same sample from all five microphones:
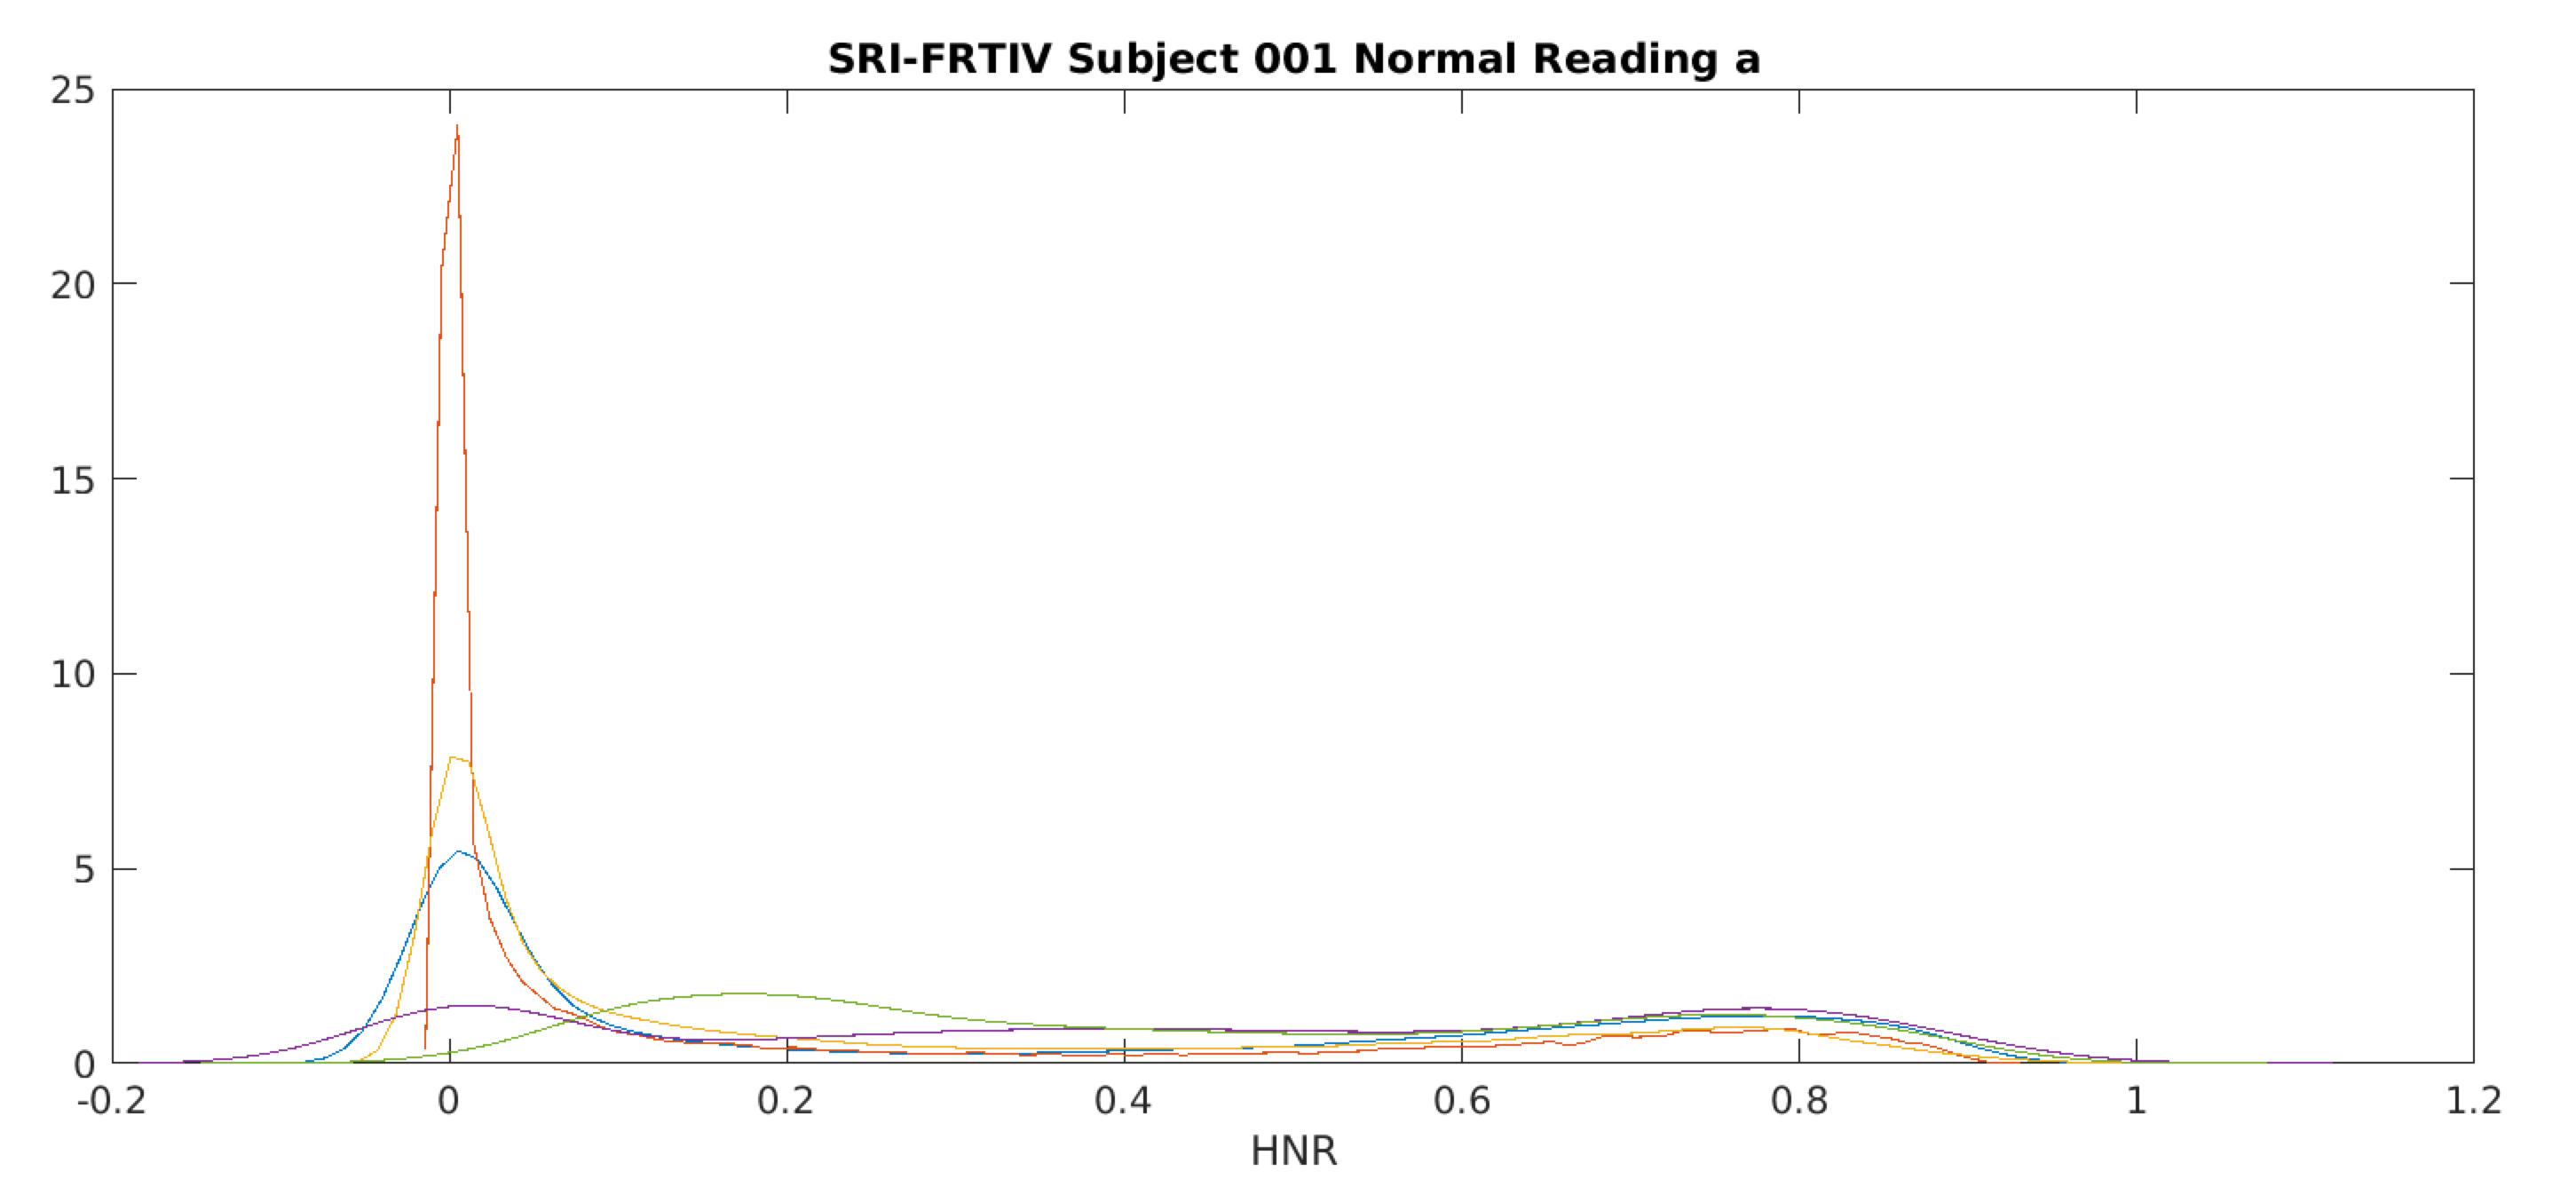
Here are smoothed histograms of HNR for the five microphones across the full 225 seconds of that particular performance:
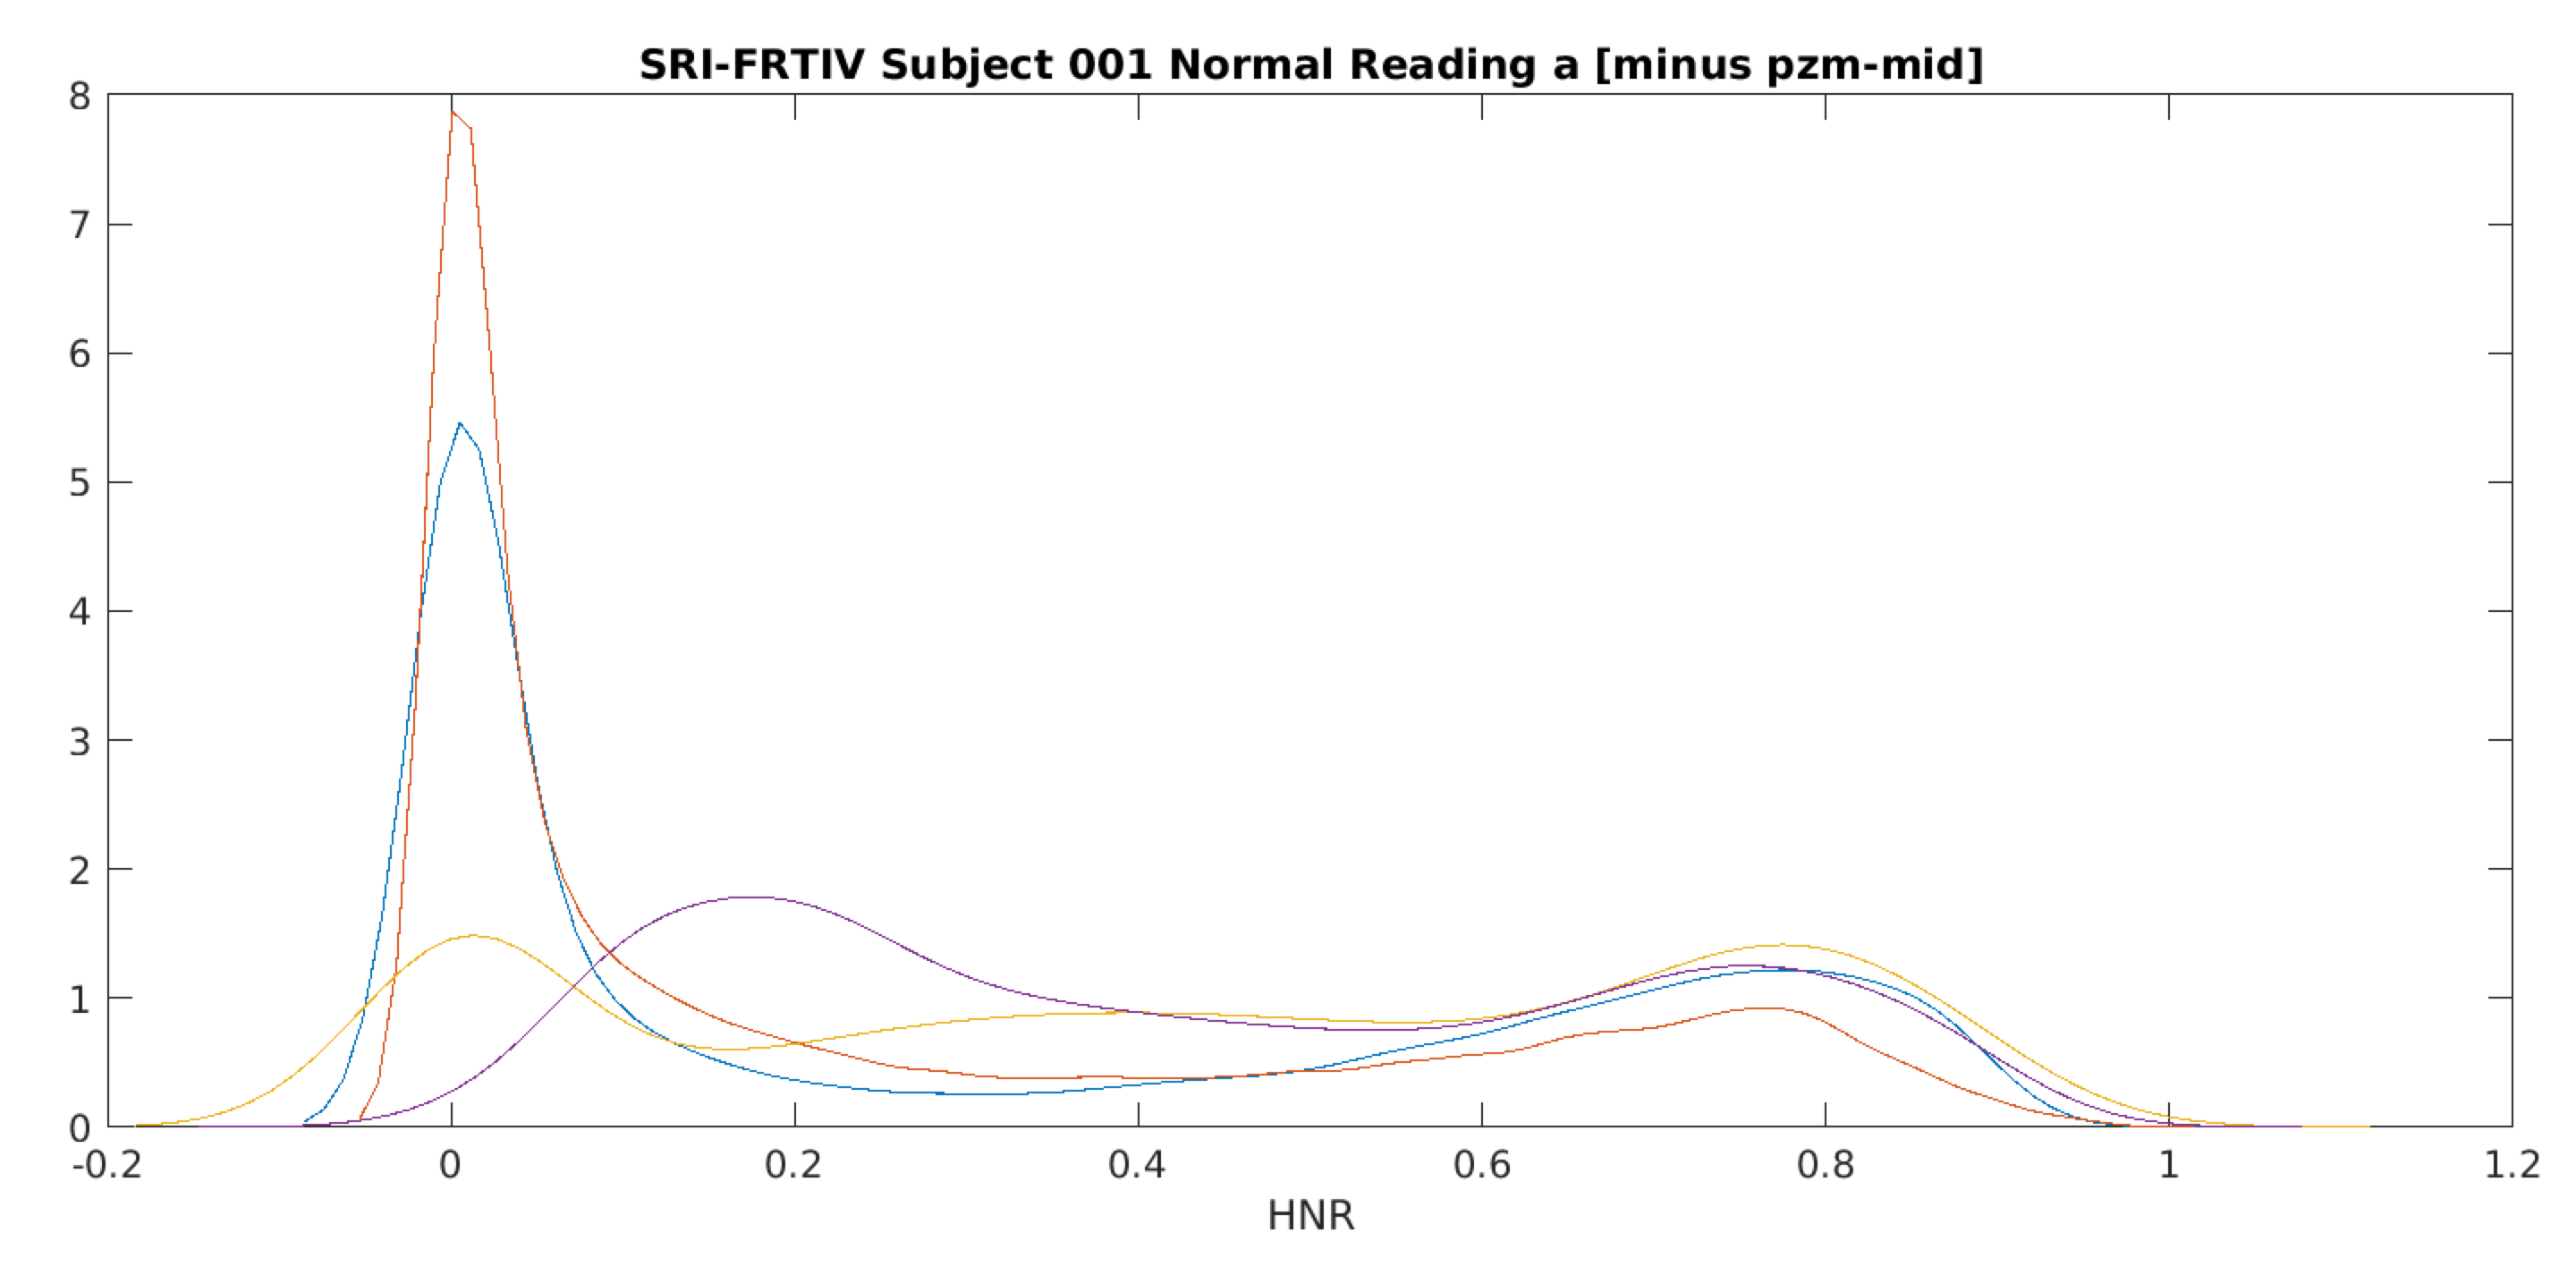
And here's the same thing after removing the data for one microphone that had a very different y-axis maximum from the rest:
These recordings all document exactly the same acoustic event, recorded at the same time in the same quiet room. And yet the the time-functions of HNR values are quite different, as are the distributions of those values.
What should we conclude from these examples?
- You should check whether your acoustic measures are significantly affected by the various ways that your recordings were made;
- If the recording methods matter (as they almost always do), document them, and check that recording differences don't co-vary with relevant differences in your independent variables;
- Explore ways to normalize the measures you use.
More later on methods (and prospects) for escaping from the trap of over-abstract physics.
Don said,
September 10, 2022 @ 9:05 pm
Do you really think physics can fully account for this phenomenon? It's pretty clear to me that there are significant social and economic factors at work as well.
MattF said,
September 11, 2022 @ 6:39 am
How about using a -local- HNR? Define a coherence length locally, generate a 3D grid of HNRs from your data, interpolate, test for stability, etc.
Allan from Iowa said,
September 11, 2022 @ 9:38 am
Don, I think the point here is that you have to control for the physics first. Otherwise the effects that you attribute to other factors may be bogus.
cervantes said,
September 12, 2022 @ 2:26 pm
While this helps us distinguish between Andrea Bocelli and Joe Cocker, it isn't self-evident what other purpose it has. Can you explain why we should care?
[(myl) If you scan through Google Scholar's hits for "harmonic to noise ratio", you'll find applications to bearing-fault analysis, parkinsonism diagnosis, the effects of hormone-replacement therapy, vocal-fold lesions, emotion recognition, dog barks, autism detection, and so on.]
Madhuri Kherde said,
September 17, 2022 @ 6:30 am
Of course, to avoid defective recordings, we should check whether our acoustic measures are significantly affected by the various ways our recordings were made.
Rod Johnson said,
September 20, 2022 @ 7:21 pm
"Madhuri Kherde" seems to be a bot that simply rephrases bits of the post, with its name linked to a sketchy loan site.