What does this graph mean?
« previous post | next post »
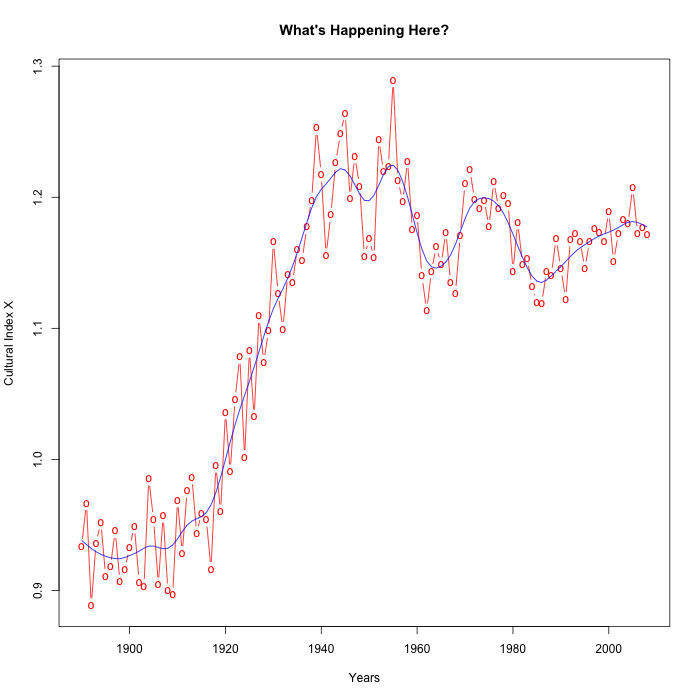
It's a time series, from 1890 to 2008, of a certain socio-cultural index. The points in red are the year-by-year values; the blue line is a smoothed ("spline") version of the sequence.
If you had to summarize this plot to someone over the phone or in text-only form, how would you do it? I might say something like
It starts at about 0.95 through the 1890s and 1900s. Then around 1915 it starts rising, and keeps on going up to a peak of about 1.25, around 1950. Then it comes down a bit, and wobbles around until the present, in the range of 1.15 to 1.2.
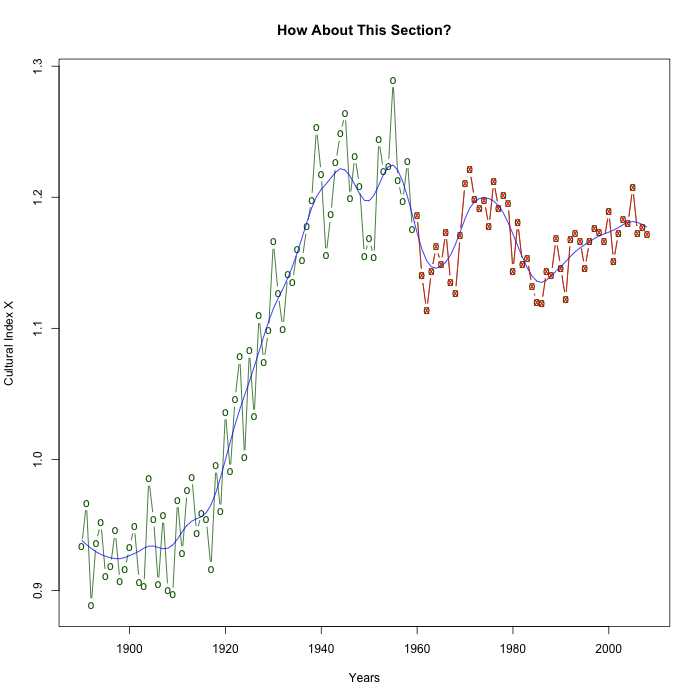
OK, suppose we zoom in on the period from 1960 to 2008, plotted in red below. How would you describe that part?
I'd say something like
Well, it goes down a bit through the mid-1960s, then it rises a bit through the early 1970s, then it falls a bit again into the early 1980s, and then it gradually rises over the past 25 or 30 years. It ends up just about where it started.
So what is this mystery time series?
Ayn Rand, author of Atlas Shrugged, might have called it the "collectivism index", or the "herd index". .Jean Twenge, author of Generation Me: Why Today's Young Americans Are More Confident, Assertive, Entitled–and More Miserable Than Ever Before, might call it the "cooperation index", or the "we over me index".
And Prof. Twenge and her co-authors, focusing on the section of this dataset from 1960 to 2008, conclude that
Individualistic words and phrases increased in use between 1960 and 2008, even when controlling for changes in communal words and phrases. Language in American books has become increasingly focused on the self and uniqueness in the decades since 1960.
Furthermore,
The use of both individualistic words (Study 1) and phrases (Study 2) increased over time in a very large corpus of books in American English. This increase remained significant even when a sample of communal words and phrases also generated by a modern sample was controlled for statistically.
We interpret these changes in published language as reflecting broader cultural changes. That is, we believe these data provide further evidence that American culture has become increasingly focused on individualistic concerns since 1960. Using cross-temporal data to assess cultural change over time within one country is similar to using cross-cultural data to assess differences between cultures during the same historical period. Thus, America today is culturally distinct from America in 1960– at least in the realm of individualism.
I doubt that any of you, looking at the time series plots above, came to the conclusion that the "we over me index" has fallen markedly since 1960. It basically ended up where it started — and if anything, the trend over the past couple of decades seems to be anti-individualistic, as measured by this index.
And what is this index, really?
What it is, in simple fact, is the time series, from 1890 to 2008, of the ratio of aggregate counts of 20 "communal" words to the aggregate counts of 20 "individualistic" words, where the counts are taken from the American English data in the Google Books ngram collection, and the "communal" and "individualistic" word lists come from Jean M. Twenge et al., "Increases in Individualistic Words and Phrases in American Books, 1960–2008", PLoS One 7/10/2012.
Twenge et al.'s "communal" word list is
communal, community, commune, unity, communitarian, united, teamwork, team, collective, village, tribe, collectivization, group, collectivism, everyone, family, share, socialism, tribal, union
Their "individualistic" word list is
independent, individual, individually, unique, uniqueness, self, independence, oneself, soloist, identity, personalized, solo, solitary, personalize, loner, standout, single, personal, sole, singularity
Now, Twenge et al. came to their conclusion on the basis of a different sort of analysis of the underlying time series data in question:
Individualistic words increased in use in American books between 1960 and 2008. The correlation between year and the sum of the 20 individualistic words was r(49) = .87, p<.001. The 20 individualistic words combined made up.096% of words in books published in 1960, and.115% of words in books published in 2008. With an SD of.0063, this is an increase of d = 3.02. […]
When both individualistic and communal words are included in a regression equation predicting year, only individualistic words are significant (Beta = .83, p<.001; for communal words, Beta = .05, ns).
They did a separate analysis based on looking at the unigram data in terms of z-scores, and they tabulated and analyzed a set of "communal" and "individualistic" phrases as well. It's clear that they were looking for more evidence in favor of Prof. Twenge's "me generation" theme. I'll leave it as an exercise for the reader to sort out the actual relationship between their data and this conclusion; but in my opinion, the prima facie case is very weak for the conclusion that (as the USA Today story put it) "An analysis of words and phrases in more than 750,000 American books published in the past 50 years finds an emphasis on 'I' before 'we' — showing growing attention to the individual over the group".
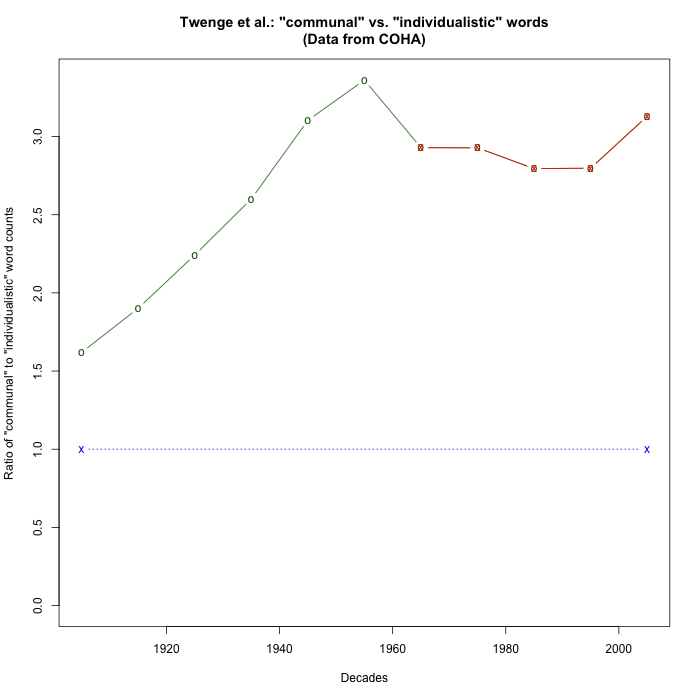
It's more interesting, in my opinion, to ask what's going on in the part of the time series that Twenge et al. ignored, namely the section from 1890 to 1960. It's possible, of course, that the obvious trend is an artefact, caused by a change in the Google Books mix of genres over time, or some other relatively uninteresting factor. But as I noted yesterday, replication in an independent (and better-controlled) historical dataset shows a very similar overall pattern (though with all of the ratios shifted upwards, presumably due to an overall difference in genre mix):
If you really believed in this cultural index, you might tell a story about it like this one:
As a result of the Russian revolution and related historical trends, American interest in "communal" topics increased sharply through the period 1917-1945. During the period 1945-1965, several factors — the start of the cold war, the McCarthy period in the 1950s, and the individualistic aspects of the counterculture — all combined to bring this trend to a halt and even to reverse it slightly. Since then, various socio-cultural forces have pushed the index up and down, without in the end changing it much.
Do I believe in this index enough to endorse such interpretations? No, I don't. Do I think that a more careful examination of such data might lead to something interesting along these lines? Yes, I do.
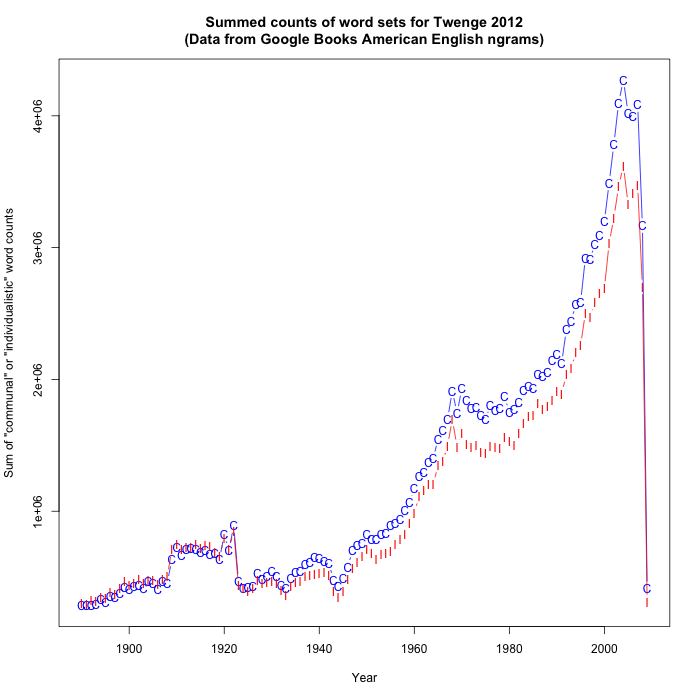
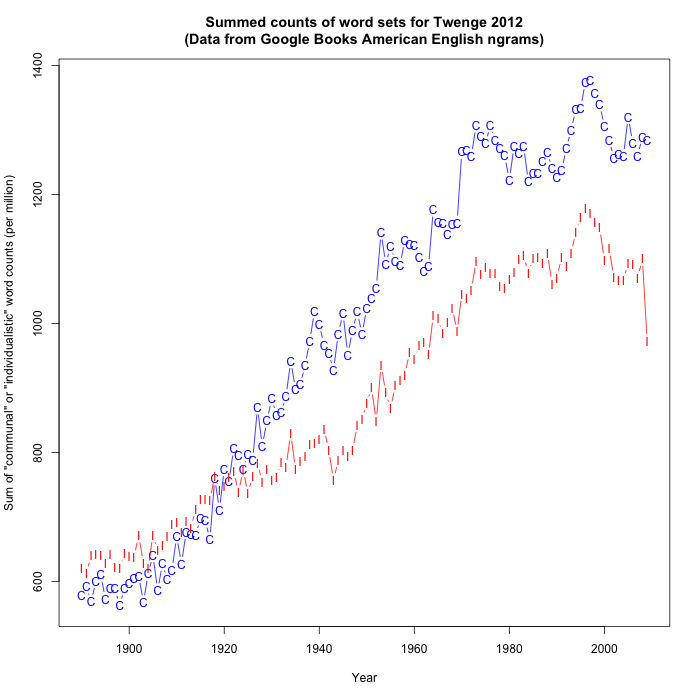
Here are a few more graphs that may help to clarify the nature of this particular data set. The time series of raw (summed) frequency counts (I've included the incomplete 2009 data, which was omitted in my plots above and also in the analysis by Twenge et al.):
The blue line with 'C' plotting points represents the "communal" words, while the red line with "I' plotting points represents the "individualistic" words. Here are the summed counts normalized by the total yearly word counts, and scaled to equal frequency per million words:
My times series data can be found in three files: TIdata (the yearly counts of "individualistic" words from 1890 to 2009), TCdata (the yearly counts of "communal" words from 1890 to 2009), AmEngUnigrams (the yearly total words, pages, and books from the Google Books American English collection). Twenge et al. have not made their numbers available, as far as I can tell. Note that the Google Books data does not collapse over case, so that e.g. "solo", "Solo", and "SOLO" are all distinct items. I counted only the all-lower-case versions of the words; they don't say what they did. If you want the rest of the data, it's available on the Google Books ngram web site.
Code is here.
Update — Following up on Erez's comment, I agree that an extended exploration of this example (and related examples) would be worth doing. Some obvious ideas:
- Add time-series data for a large set of related words, perhaps created by extending the Twenge sets through thesaurus links or LSA distance or distributional similarity.
- Use the larger dataset to explore various approaches to the aggregation problem, e.g. via functional principal components analysis or other dimensionality-reduction techniques.
- Compare the time series of the (extended?) "communal"/"individualistic" word sets with those of randomly-selected words with generally similar frequency profiles.
No doubt readers who know something about time-series analysis will have other and better ideas. One helpful thing would be to make available code for a better general interface to datasets of this kind. The Google ngrams web site is cute, but offers graphs rather than numbers. The data is easily available, but it's large enough that simple approaches to computing over it are rather slow. My first attempt to create a simple perl interface to a database back-end ran aground on scale issues — so I'll try again when I have a chance, and will be happy to share the results. But if someone has already done it, or gets it done before I get back to it, I'll be happy.
Erez Lieberman Aiden said,
July 15, 2012 @ 9:33 am
<<>>
Hi Mark!
This is great: loving how these sorts of abstract questions can now be argued, at least to some extent, from the data. I just wanted to follow up on 2 bigger-ticket issues with the data that have already been pointed out on this thread. <<>>
First, Andy Averill is right. The data after 2000 is generally not commensurable with the data before 2000, and for precisely the reason he suggests. This is why in our original study, the examples targeted the period from 1800-2000, and did not include subsequent data. It's also why this is the default period for the Ngram Viewer. We discuss this issue more fully in the supplemental materials of the paper, III.0.1.2) [Sources of bias and error/Composition of the corpus]. The supplemental materials are available at Science together with our original paper, or at: http://bit.ly/pI3J83.
Second, Bruce Rusk's concern is a reasonable one, and, as we've noted before, it's unfortunate that we were unable to disclose the bibliography of the various n-gram corpora for legal reasons. That said, we did make a pretty useful corpus available for trying to alleviate, among other things, Bruce's concern.
Here's what we did. Google is constantly generating, and improving, a catalog which attempts to collect metadata for all recorded books based on over 100 sources of bibliographic metadata (supp. I.1. [Metadata]). This catalog was about 10 times the size of the collection that Google had actually digitized at the time we created the original ngram data. The catalog is almost certainly more representative of books as a whole. We then examined the BISAC code distribution of Google's bibliographic database over time, and created a corresponding corpus, called "English One Million". The year-over-year BISAC code distribution of Eng-1M is adjusted to match that of the bibliographic database as a whole, so that it is less likely to exhibit dramatic composition biases w.r.t. the books published in a given year. See Supp. II.3B, where the English One Million corpus is described in greater detail. This corpus can be selected at the Ngram Viewer, and the underlying data can be downloaded. We recommend that anyone publishing a result using the English ngram data repeat their analysis with "English One Million" just to make sure there are no anomalies. FWIW, there doesn't seem to be much difference for "individual, community" in "English One Million" ( http://bit.ly/Mrr3Re ) vs. plain old "English" ( http://bit.ly/NZSoG3 ). Of course, BISAC-balancing in this way is far from an ideal solution, but people should know that the data is out there.
Supplemental Materials for our paper: http://bit.ly/pI3J83
(Ngram users of the future: please read these before publishing using the data, otherwise you almost certainly won't know something you need to know.)
Erez Lieberman Aiden said,
July 15, 2012 @ 9:34 am
Apologies for the double post; didn't quite know where to put this since there's several threads on this issue now.
The comments I refer to are on the 'textual narcissism' thread.
[(myl) Hi Erez! I've added links to the relevant comments in your remarks above.]
Ted Underwood said,
July 15, 2012 @ 9:42 am
You're doing God's work, Mark. I found the PLoS One study profoundly troubling when it came out — mainly because the methodology for generating the wordlists was ad hoc and guaranteed a presentism bias. (They do acknowledge that lists generated by present-day selection are going to be inherently biased toward "recency" in the PLoS One article, but it seems to me a really fundamental problem.)
But your quantitative analysis has shown that there are problems on a strictly quantitative level as well. For one thing, it deserves comment that the "individual" and "communal" wordlists track each other so closely. That often happens with antonyms — opposed ideas are used *together* — and it should have hinted to the researchers that they're not fundamentally looking at a tradeoff or inverse correlation. So while you can observe changes in this ratio, it's not safe to assume that a change is significant. Also, as you rightly point out, it seems esp. dubious to select the post-1960 moment for comment.
Erez Lieberman Aiden said,
July 15, 2012 @ 10:41 am
Yeah, ditto on what Ted said. This is a fantastic example – hopefully, if the stream of excellent posts and comments keeps up, it will ultimately become a paradigmatic example – of how to dissect and critique an n-grams result.
I should preface this by saying that I've not carefully read the paper, although I looked it over the day after it came out. Presentism is a definite issue; JB and I have struggled many times with the issue of changes-in-terminology-for-a-single-referent. You can only do so well in this department, and it can be a particularly significant confound for very abstract things, like individualism vs. communalism. (Much easier to track a person or a year.) Small sample size for the term set could also be a factor.
Aggregation is a huge issue. When you have an ensemble of n-grams, they typically have extremely heterogeneous frequencies. In such a scenario, one or two terms can very easily dominate, and the trend seen with the aggregate count just becomes the trend seen for the top term or two. How to best study the aggregate is a serious question. I should point out that this issue is relevant both to the original paper, and to your critique.
One thing I was surprised by is that the paper has no figures; I'm guessing that, if there had been a few figures, it would be easier to see what their logic was.
That said, it's important to note that the original study is pretty upfront about several of the points being made here: it at least makes reference to the issues with corpus composition after the year 2000; it does try to deal with presentism (in part via the use of "communal" terms, a reasonable, though not bulletproof, approach [I would have liked to see much more regarding this issue]); and it does point out that communal terms are rising and claims to try to control for this. The question is, have they adequately done so? Your data suggests not.
Anyway, I would love to see Jean's take.
Henning Makholm said,
July 15, 2012 @ 10:52 am
I think what the graph shows is a greater cultural preoccupation with mathematics in general and perhaps in particular differential equations more than algebra.
Independent, unique, uniqueness, independence, identity, solitary and singularity are all words you would find a such a text. On the other hand, the mathematically relevant words in the "communal" collection are unity, group, family, union, which are both fewer and seem vaguely to have a more algebraic bent than the "individual" words.
(Less tongue-in-cheek, it confuses severely that anyone would think merely counting the occurrences of words tells anything about the speakers' attitude to whatever the words signify. If you analyzed Demosthenes's speeches using the same techniques, you would probably conclude that he was a fervent supporter of Macedonia.)
[(myl) Indeed — in the course of a discussion a few years ago about quantitative measures of media bias, I offered a small empirical test of the plausible hypothesis that these days, references to Karl Marx are more likely to come from the political right than the political left. (See here and links therein for background.)]
D.O. said,
July 15, 2012 @ 11:01 am
Judging by interoccular trauma caused by the last plot, there is strong year-to-year correlation between "communal" and "individualistic" word ratios. Why would it be so?
[(myl) I assume you mean "between C and I word *frequencies*"… And there are several possibilities. First, the frequencies of individual words do change over time, for two quite different sorts of reasons. Word frequencies can change because of changes in how much people talk about certain things. Thus the frequency of "war" shows clear blips for WWI and WWII, and a smaller blip for Vietnam. And the frequency of "carriage" has been in decline since 1900 or so. But words can also go gradually in and out of fashion, without any obvious underlying topical reason (like the past 80 years of increase in "theodicy", or the similar period of decrease in "unpleasant"?). And second, the behavior of different words can correlate with one another because of an underlying topical relationship (like "horse" and "carriage") or for no particular reason at all (like the correlation between the decline of "carriage" and the decline of "apothegm"). Sums of word frequencies (especially when the sum is dominated by a few words) are basically the same: they might co-vary because of some shared underlying cause, or for no good reason at all.]
I've tried the following numerical check. For each year from 1895 to 2003 I've calculated moving average of C and I word counts given in TIdata and TCdata and also total word counts from AmEngUnigrams centered on each year and spanning 11 years. This is done to remove the long term trend. Then I've calculated the ratios C/All and I/All for moving averages and yearly excess as the difference of ratio in a given year to the ratio in the decade (or should it be called undecade?). Covariance between excess for C and I ratios is 0.6. I did not do any p-values, but the effect is clearly there.
Now what's the reason? Optical analisis of excess graphs does not reveal any obvious reasons like periods where correlation was especially strong because the change was rapid. Thus I am inclined to suggest that the main or at least substantial part of the correlation comes from (book) discussions of communal vs. individualistic topics such that counts for both sets of words will track each other.
I cannot reference the code, because none exists. Everything's done in Excel.
peterv said,
July 15, 2012 @ 11:49 am
Further to Henning Makholm's comment:
Why stop at analysis of indivdual words when making assertions about speaker meaning? We could encode all these words into binary digits (using, for example, an ASCII encoding) and then count the relative proportions of ones and zeros in each category! Surely a preponderence of ones over zeros would indicate a speaker bias in favour of individualism, in comparison to the self-deprecating (and hence community-favouring) use of zeros. The digit "1" even looks like an upper case letter "I", for goodness sake, (at least, when each is expressed in the appropriate alphabet and font.)
[(myl) I'd be willing to make a modest wager that the resulting time series would be pretty flat, by some mutually-agreed metric. The size of the wager I'd be willing to make would increase as the number of words in the sample goes up.]
Andy said,
July 15, 2012 @ 1:18 pm
Actually, ratio of 0's and 1's in binary of ASCII representations will likely depend on whether the conversion is bytes or just 7-bit ASCII, since full bytes will always start with 0 for English words.
D.O. said,
July 15, 2012 @ 1:54 pm
Re: Prof. Liberman inline comment. Yes, of course, I meant frequencies, not ratios. My idea was that yearly fluctuation is 1) pretty noisy (you can look at your spline curve and compare it's mean square yearly change — I do not dare to suggest derivative :) — to the mean square yearly change of unsmoothed data, but I guess striking the eye is enough) and 2) cannot be caused by any strong underlying trend. Thus the correlation of detrended I and C frequencies may reasonably reflect vagaries of interest in I/C topics rather than in particular points of view. I've selected detrending as subtraction of average frequency over an 11 year period.
Garrett Wollman said,
July 15, 2012 @ 8:00 pm
Seems telling that the first downward inflection point in the plot at the top is right around the time of the Taft-Hartley Act, which significantly reduced the power of unions as compared to the previous period (since the National Labor Relations Act). I would be interested in knowing how concentrated the variability in these observations is with respect to the individual 1-grams on each list; are there one or two words (like "union", for example) which account for a disproportionate fraction of the variance?
Chris C. said,
July 16, 2012 @ 4:03 am
It looks as if a minor peak occurred in the mid-1970s. It's not all that surprising to find words like "independence" used more frequently among Americans circa 1976.
[(myl) Unfortunately, a peak in the ratio of "communal" to "individualistic" words represents (other things equal) less frequent use of words like "independence".]
Mr Punch said,
July 16, 2012 @ 6:45 am
I wonder if the recency issue with regard to the words being tracked doesn't apply primarily to the 1900-1960 (or 1920-1950) period, for reasons somewhat different from (but related to) those suggested above. Actual politics aside, there was a rising influence of Marxist thought across a broad swathe of culture; but there was also the influence of Freud, and of other psychologists and social thinkers – I still hear, for example, reference to Maslow's hierarchy of needs. More than 50 years ago, the late historian Henry May posited a shift in American culture in 1914-17 that marked the birth of "our own time"; perhaps that holds up linguistically.
Chris C. said,
July 16, 2012 @ 9:29 pm
I did, indeed, have my head on sideways.
Lyrics, Dude… Part 1 | The Trait-State Continuum said,
July 31, 2012 @ 12:17 pm
[…] http://languagelog.ldc.upenn.edu/nll/?p=4073 Share this:TwitterFacebookLike this:LikeBe the first to like this. This entry was posted in Gen Me, Pop Culture, Questionable Conclusions, Stupid Stuff and tagged GenMe by mbdonnellan. Bookmark the permalink. […]