My poster for the "Prosody Visualization Challenge"
« previous post | next post »
See "PVC 1" (4/20/2018) for background. I ran the 51 PVC 1 audio files through the scripts described in "Some visualizations of prosody" (10/23/2016), and ginned up a poster describing a few of the results.
Unfortunately poster-display technology doesn't yet include embedded audio playback, so this is an interactive version of the same content. [Note: the poster mistakenly describes example 1.b. as being from a Donald Trump interview, rather than being from his inaugural address.]
Abstract: There are many possible ways to visualize prosody-related acoustic measurements. This poster explores two simple examples:
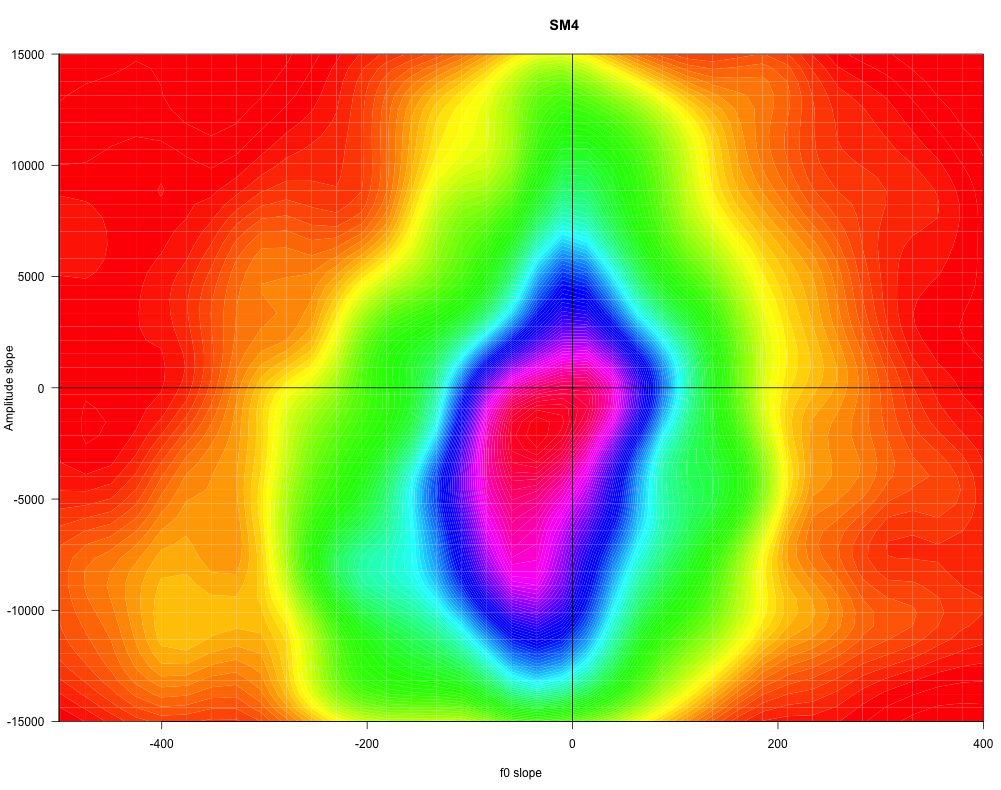
- The joint distribution of delta f0 and delta amplitude.
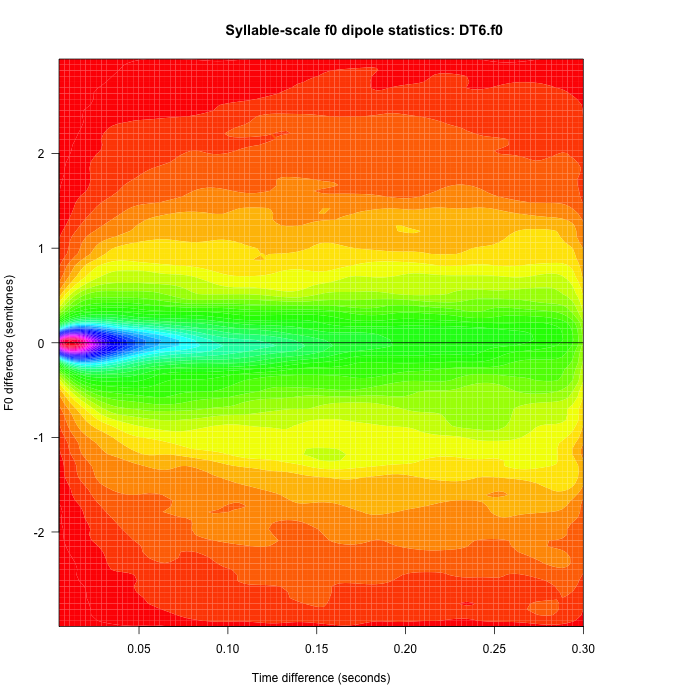
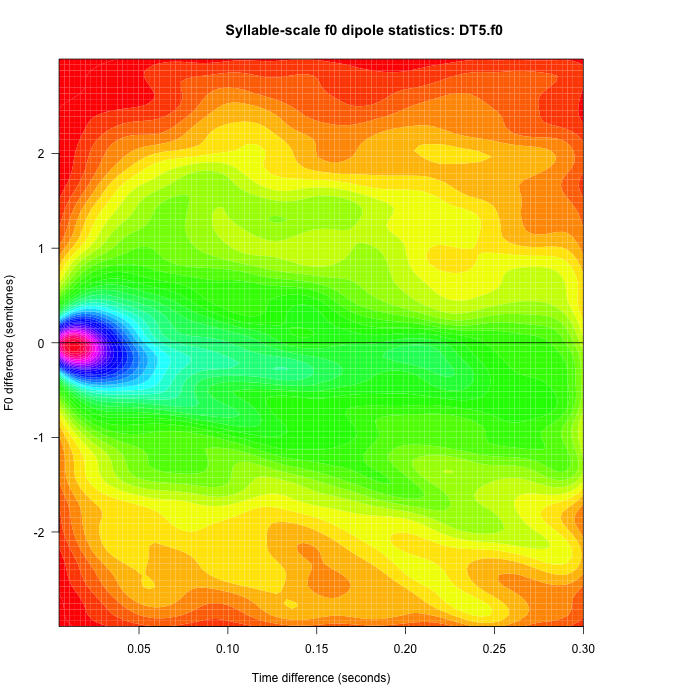
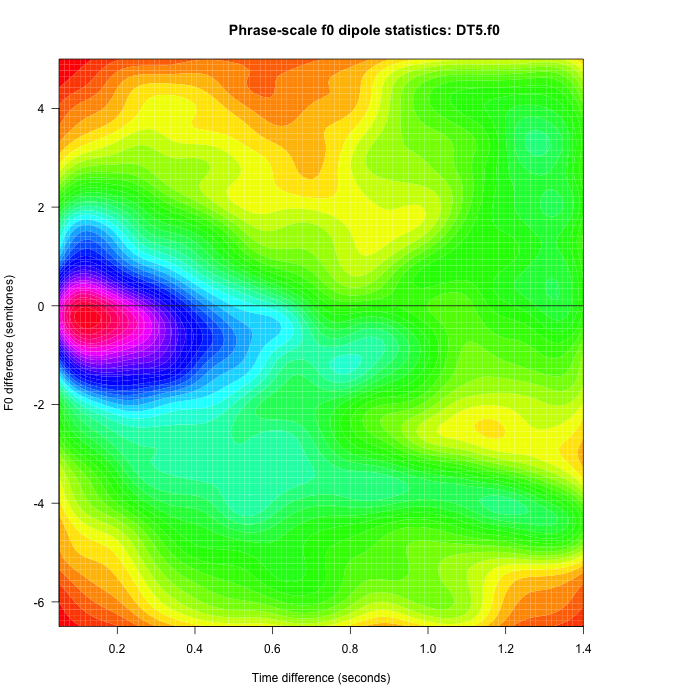
- A dipole plot of f0 differences as a function of time differences.
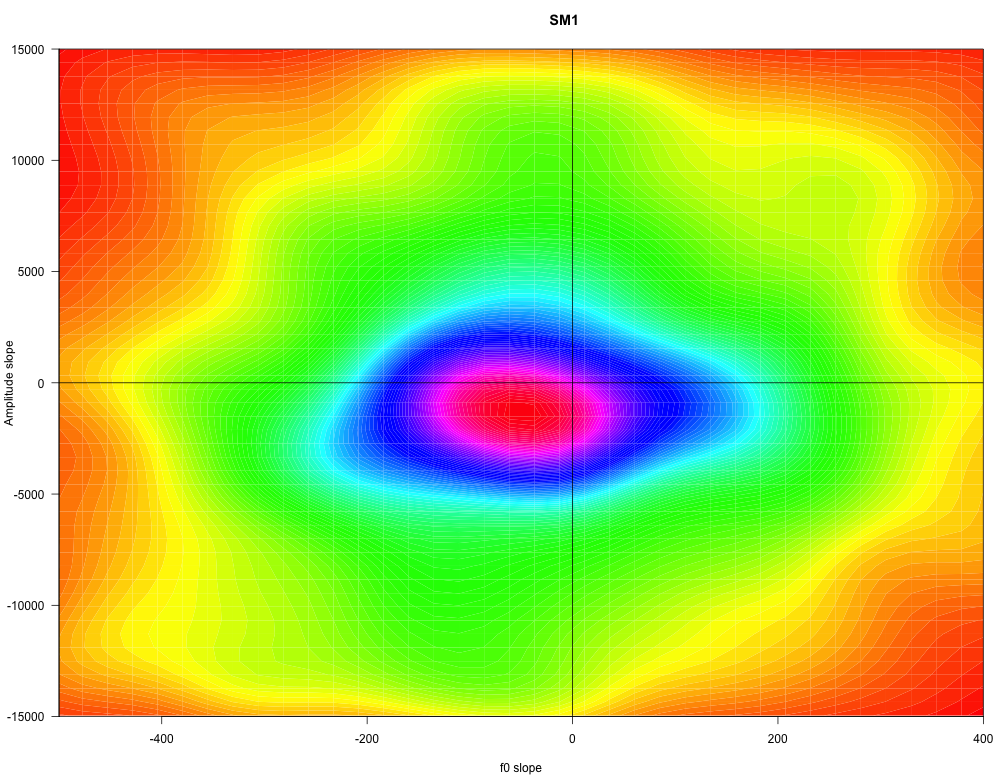
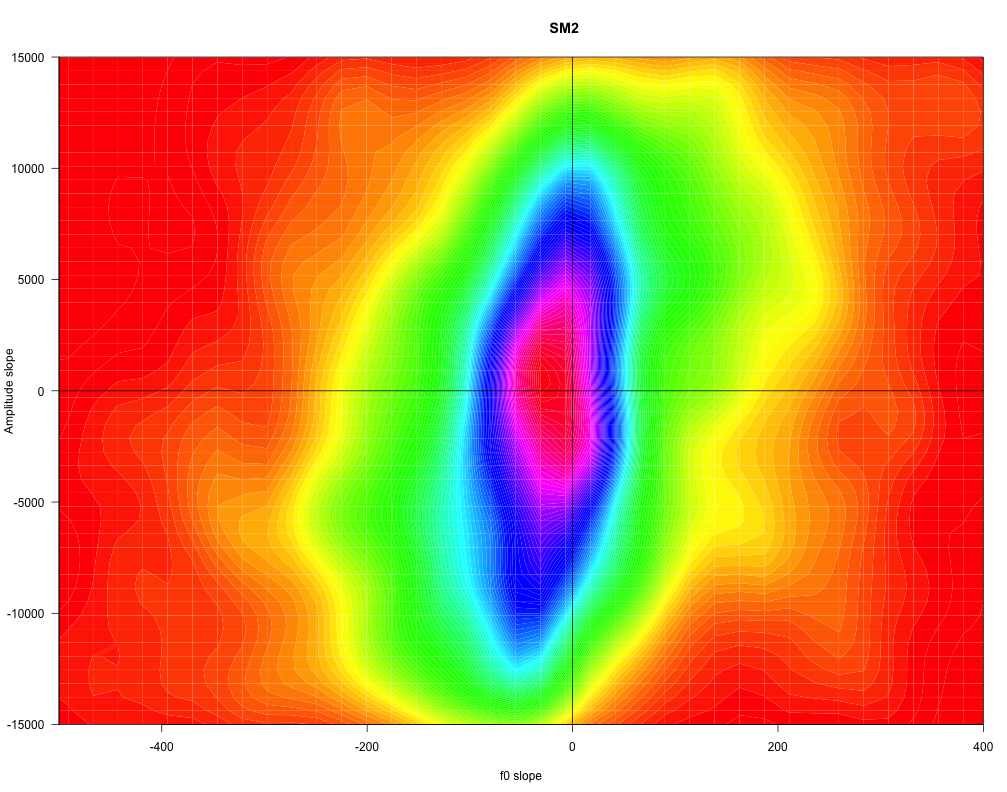
Because amplitude contours correspond approximately to syllabic "sonority", the relationship between f0 changes and amplitude changes tells us something about the phase relationships between f0 movements and syllable positions — rises, falls, rise/falls, fall/rises, etc.
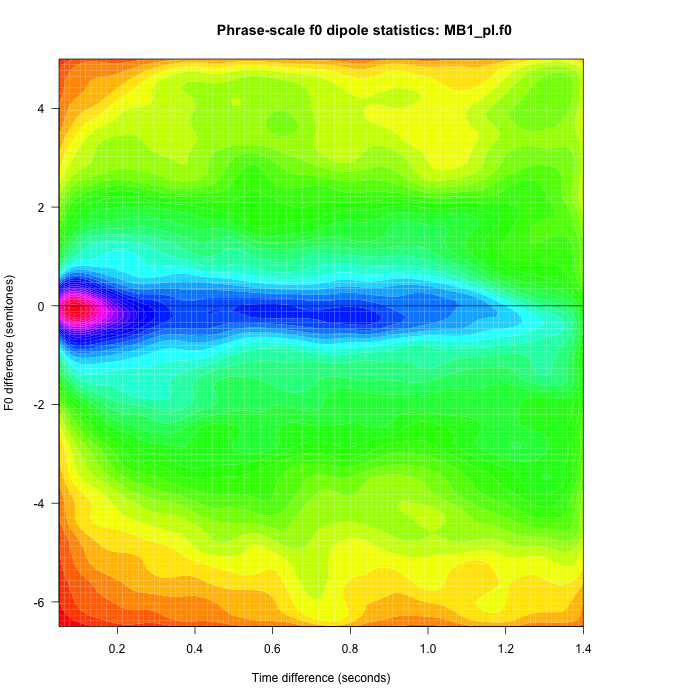
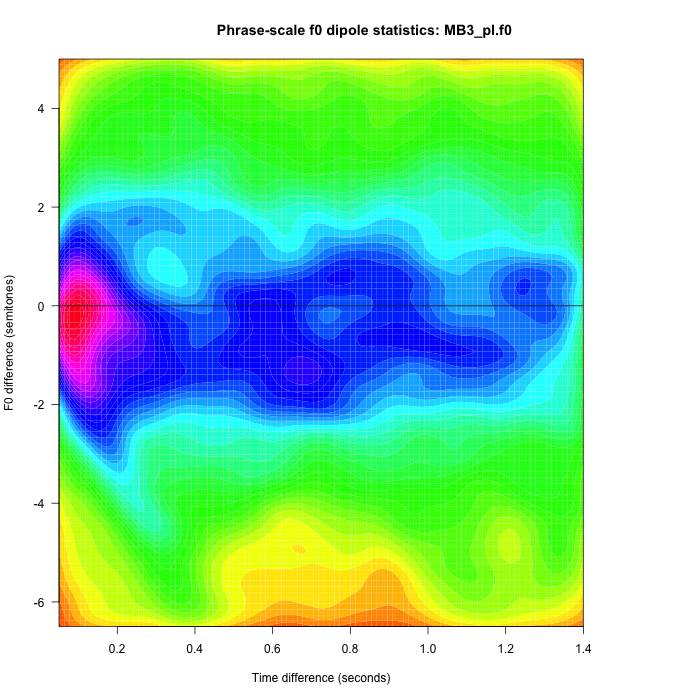
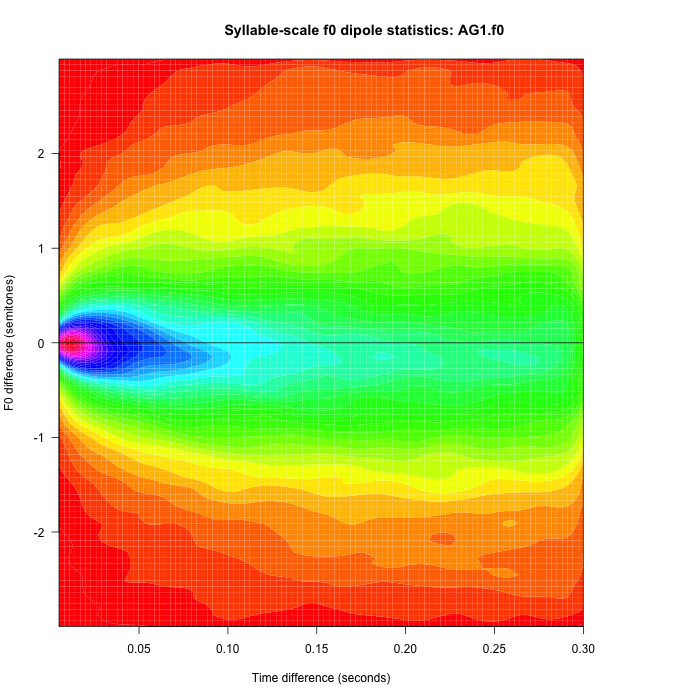
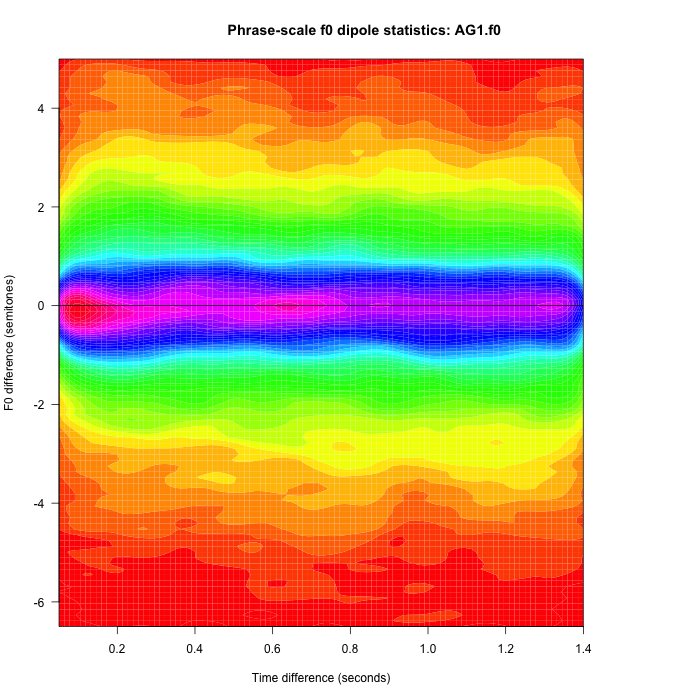
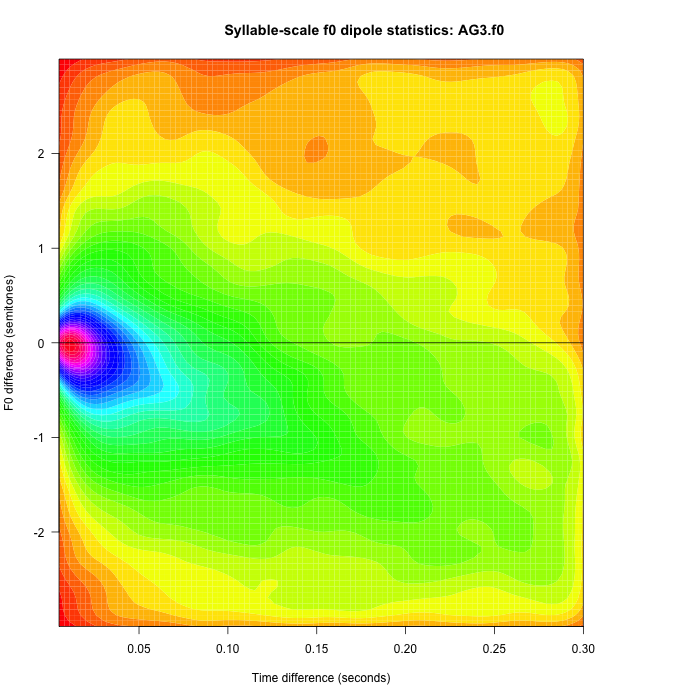
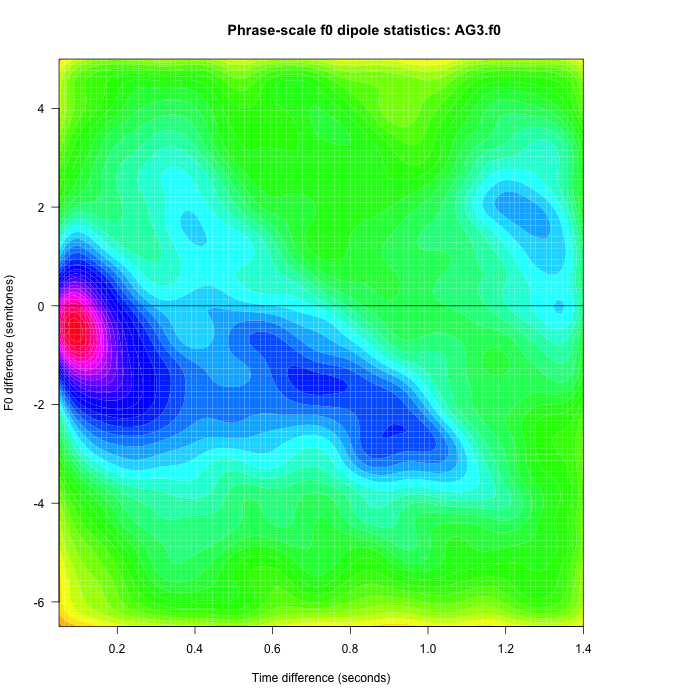
We can also calculate the f0 differences versus time differences at various time scales, e.g. the scale of syllables and the scale of phrases. And the results show us the balance of f0 changes of different directions at different time scales.
In all plots, we use log measurements (e.g. semitones for f0 and dB for amplitude).
Methods: The input to the process is just a time function of f0 and amplitude measurements, sampled at 200 Hz (= 5 msec frame step). I've used get_f0a but any decent pitch tracker will be fine.
Then a couple of simple R scripts, one for each type of plot, do the rest of the work. Copies of these scripts can be found here and here. These scripts assume an input file consisting of text lines, one per analysis frame, where the first field is the f0 estimate, the second field is indicates voicing (1 or 0), and the third field is RMS amplitude.
Examples:
1.a. Syllable-scale and phrase-scale dipole plots for a clip from a Donald Trump 10/2016 rally:
 |
 |
1.b. Syllable-scale and phrase-scale dipole plots for the opening of Donald Trump's inaugural address:
 |
 |
2.a. Syllable-scale and phrase-scale dipole plots for a clip from Allen Ginsberg reading Howl, 1956:
 |
 |
2.b. Syllable-scale and phrase-scale dipole plots for a clip from Allen Ginsberg discussing Howl, 1956:
 |
 |
3.a. Phrase-scale dipole plot for Miron Białoszewski reading from “Aniela w miasteczku Foligno”:
3.b. Phrase-scale dipole plot for Miron Białoszewski reading from “Ach gdyby gdyby nawet piec zabrali”:
3.c. Phrase-scale dipole plot for Miron Białoszewski discussing Shakespeare's The Tempest:
4.a. DeltaF0-DeltaAmp plot for M.L. King sermon:
4.b. DeltaF0-DeltaAmp plot for M.L. King interview:
5.a. DeltaF0-DeltaAmp plot for T.D. Jakes sermon:

5.b. DeltaF0-DeltaAmp plot for T.D. Jakes interview:
Discussion: In some but not all cases, these images evoke visually the acoustic impressions of the associated audio, and may thereby help us to understand the linguistic, stylistic, cultural or individual differences involved.
There are of course problems:
- Pitch tracking often fails – and indeed the construct of “fundamental frequency” is almost as problematic as ”formant”.
- Amplified, reverberant, and processed audio (e.g. studio-added AGC or ther dynamic range compression) will show up in the delta-amplitude signal (as it does in acoustic perception).
- There are many other features whose joint distributions are also relevant to our perceptions of prosody – various linear or nonlinear dimensionality reduction might yield more insightful pictures.
Some additional directions to explore:
- Animating the plots by moving a window through the input.
- Attempting statistical analysis/classification based on such features.
- Plotting reduced-dimensionality projection from larger feature sets.
References:
"Poem in the key of what", 10/9/2006
“More on pitch and time intervals in speech”, 10/15/2006.
"Dinka Tonal Alignment Without Segmentation", EFL Lecture (Paris) 2015.
“Political sound and silence”, 2/8/2016.
“Poetic sound and silence”, 2/12/2016.
“Some visualizations of prosody”. 10/23/2016.
“Overall F0 trends at syllable and phrase scale”, Course Lecture Notes, Spring 2016.
Neville Ryant and Mark Liberman, "Automatic Analysis of Speech Style Dimensions", InterSpeech 2016.
“Tunes, political and geographical”, 2/2/2017.
