Some phonetic dimensions of speech style
« previous post | next post »
My posts have been thin recently, mostly because over the past ten days or so I've been involved in the preparation and submission of five conference papers, on top of my usual commitments to teaching and meetings and visitors. Nobody's fault but mine, of course. Anyhow, this gives me some raw material that I'll try to present in a way that's comprehensible and interesting to non-specialists.
One of the papers, with Neville Ryant as first author, was an attempt to take advantage of a large collection of audiobook recordings to explore some dimensions of speaking style. The paper is still under review, so I'll wait to post a copy until its fate is decided — but there are some interesting ideas and suggestive results that I can share. And to motivate you to read the somewhat wonkish explanation that follows, I'll start off with a picture:
OK, now on to the background.
LibriVox is an initiative to create "Free public domain audiobooks, read by volunteers from around the world". They've catalogued 9,595 works in 36 languages, read by 7.422 volunteers. 8,293 of these works are in English. A "work" in this sense might be a whole novel, or it might be a short story or a collection of poetry. All of these works are out of copyright, which in the U.S. means (some legal complexities aside) that they date from before 1922.
I don't have an recent tally of the total duration of this body of material, but I believe it's more than 50,000 hours.
LibriSpeech is
a corpus of approximately 1000 hours of 16kHz read English speech, prepared by Vassil Panayotov with the assistance of Daniel Povey. The data is derived from read audiobooks from the LibriVox project, and has been carefully segmented and aligned.
Vassil and Dan made a selection across (English-language) works and readers, collected the associated texts, and put the whole thing together in a convenient form. The version of it that Neville and I used comprises a bit more than 1,570 hours of audio, read by 2,484 different people. So this is a fairly small sample of the total LibriVox collection, but it's plenty to get a survey of reading styles.
A couple of months ago, I explored some simple ways to characterize the distribution of speech and silence segment durations in a variety of kinds of speaking ("Political sound and silence", 2/8/2016; "Poetic sound and silence", 2/12/2016). It's clear that such measures show individual differences of some sort, and they can be used to make some pretty pictures; but I didn't show how to turn this approach into a systematic comparison of individuals, contexts, or styles.
Neville and I realized that the large number of readers in the LibriSpeech Corpus would let us place individual performances on stylistically-relevant dimensions, based on simple and automatically-derived measures of this general kind, and also to see where various examples of spontaneous speech would fall in the same spaces. There are conversational speech datasets with an even larger number of speakers — the Fisher English collection includes more than 6,800 speakers — so we could also come back to the question from the other side.
We decided to start with the distribution of the durations of speech and silence segments. These can be automatically determined by running a "speech activity detector". But a somewhat more reliable method, especially when different sorts of recording conditions are involved, is to use "forced alignment" of an accurate text with the corresponding audio. So that's the technique that we used.
For comparison, we decided to add two large collections of reading in a fixed style by individual speakers: a collection of Barack Obama's weekly radio addresses and a collection of George Bush's weekly radio addresses (2 speakers, a total of 13.93 hours). And on the spontaneous speech side, we took a set of Fresh Air interviews where I had previously "unedited" the transcripts to include disfluencies of various sorts (18 speakers, 8.53 hours); and a collection of interviews from YouthPoint, a radio program produced by students at the University of Pennsylvania in the late 1970s (65 speakers, 14.08 hours, now being prepared for publication at the LDC).
For consistency, we used the same alignment system on all the data sources, including re-aligning the LibriSpeech dataset.
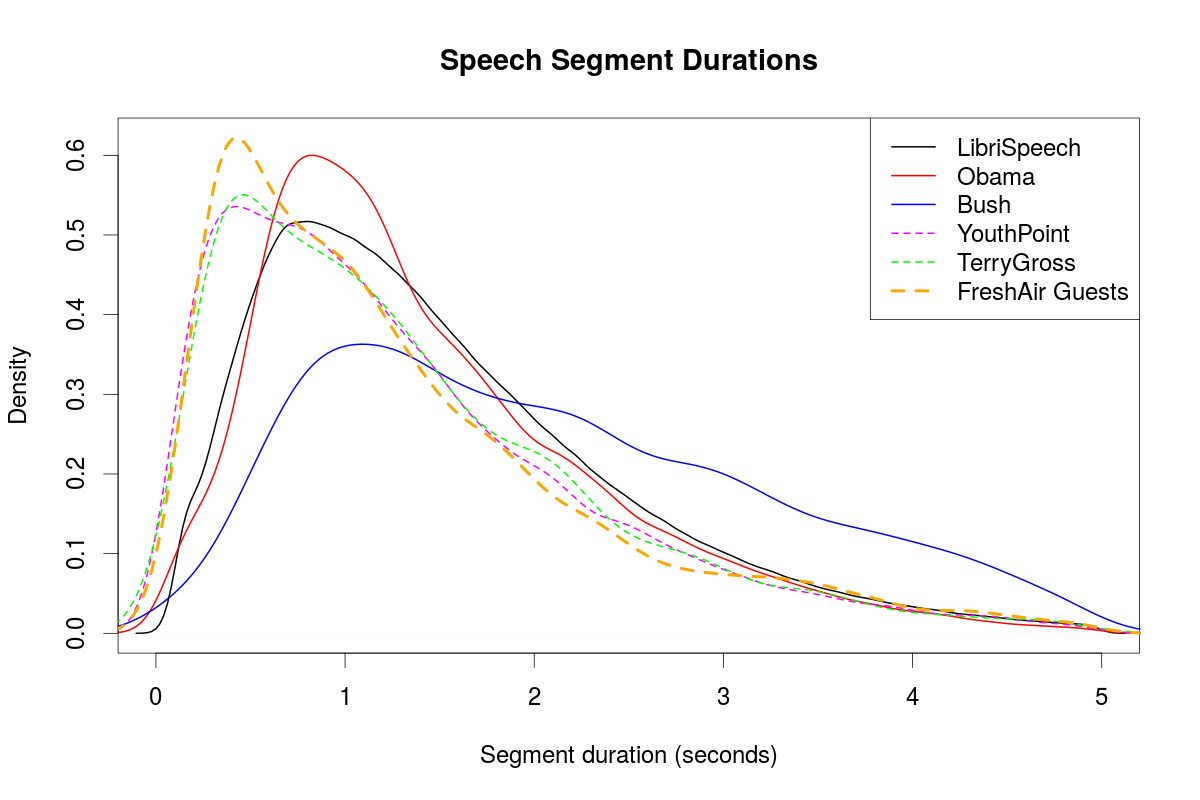
Here are density plots (basically smoothed histograms) of the speech segment durations for six categories — I've separated the Fresh Air host, Terry Gross, from her various guests, but for LibriSpeech in this plot, all 2,484 speakers are combined.
The read speech distributions are shown with solid lines, and the spontaneous speech with dashed lines. And you can see that there's a tendency for the speech segments to be shorter in the spontaneous speech collections:
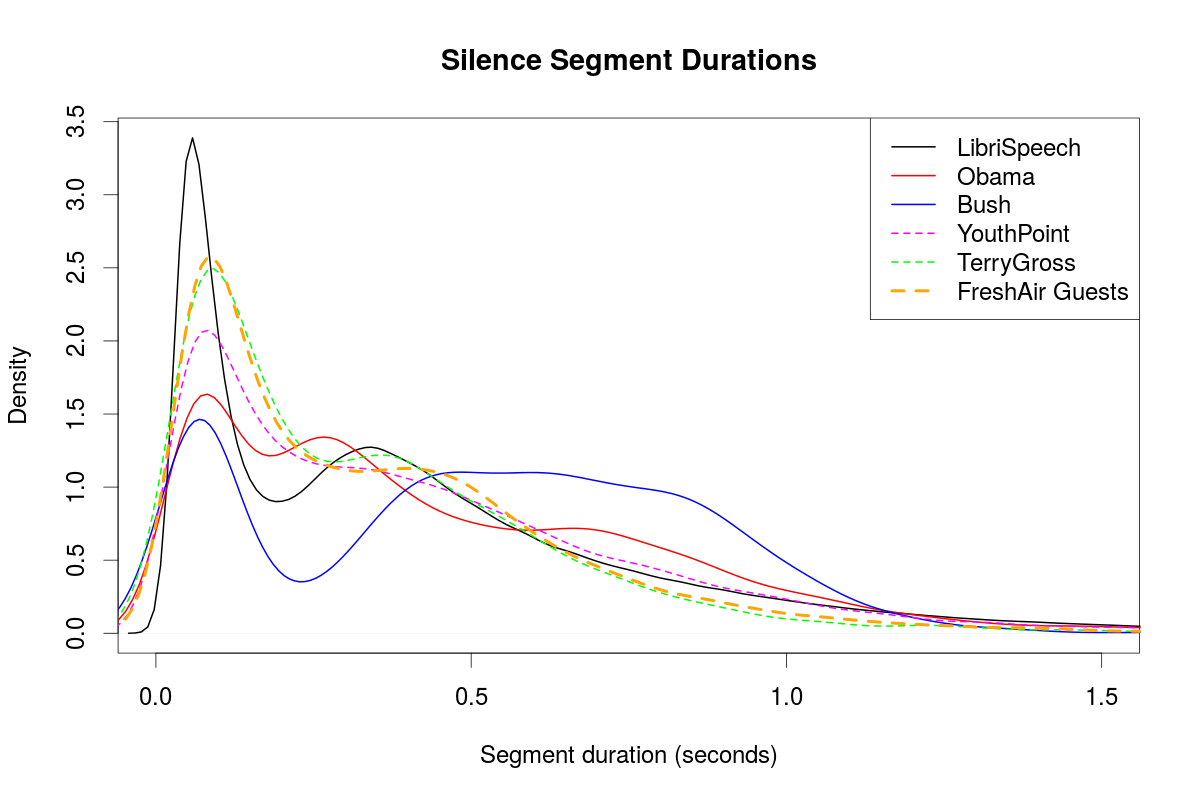
Here's a similar plot for the silence segment durations. Here it's even clearer that the distributions are multi-modal, and that at least the shortest-duration contribution tends to be shorter in the read speech than in the spontaneous speech:
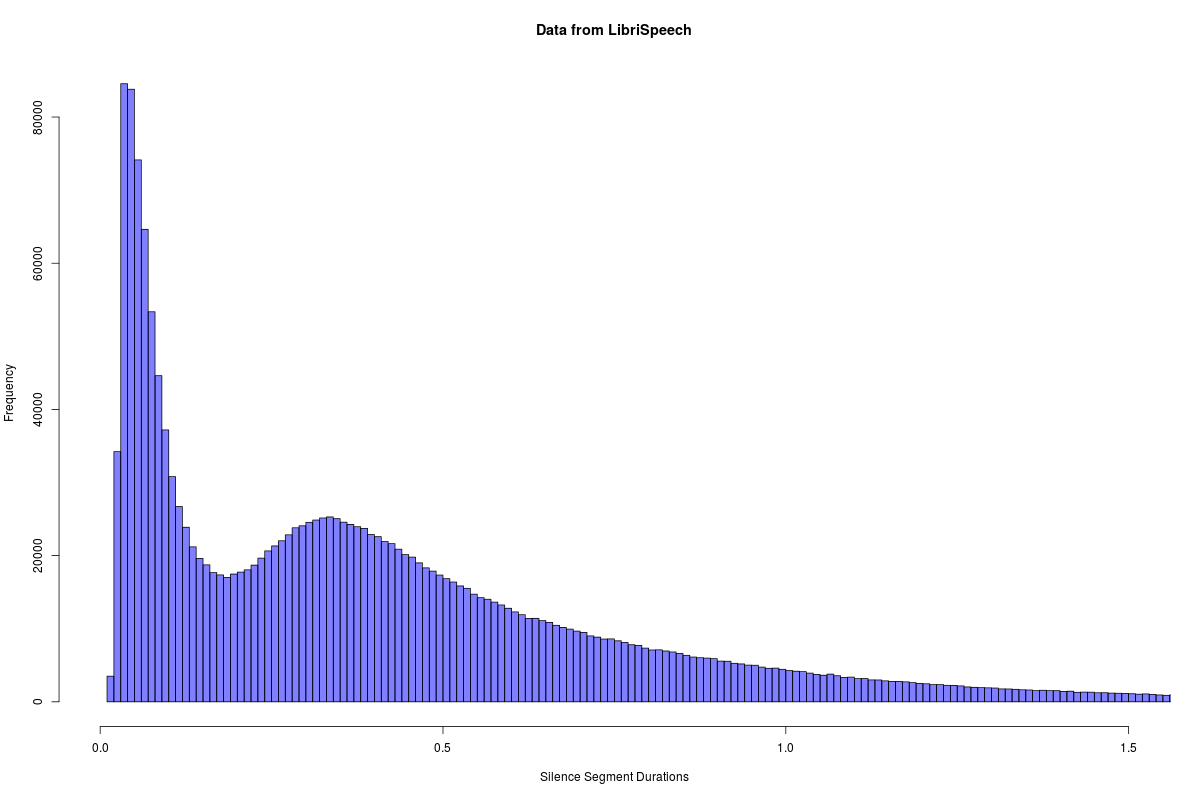
I should note in passing that with these relatively large amounts of data, the underlying histograms are very similar to the smoothed density plots:
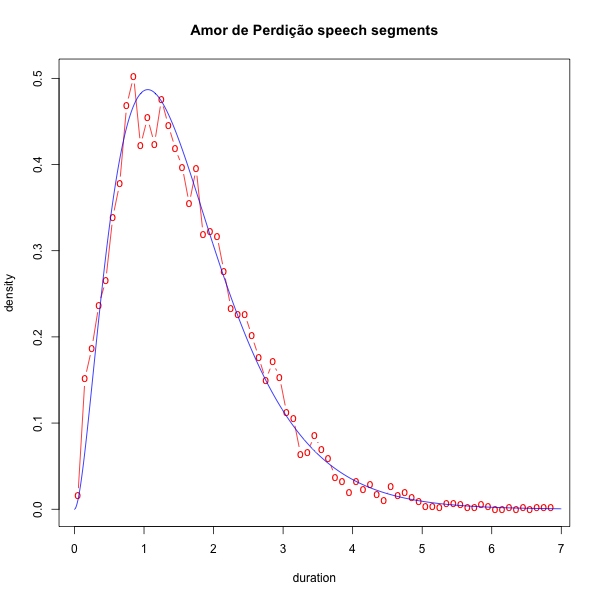
So how to reduce all this stuff to a low-dimensionality summary for comparison purposes? One plausible direction would be to fit parametric distributions — and for these durational data, a mixture of gamma distributions will generally fit very well, as I noted a few years ago with respect to speech-segment durations in a Portuguese-language audiobook ("Speech and Silence", 1/12/2013):
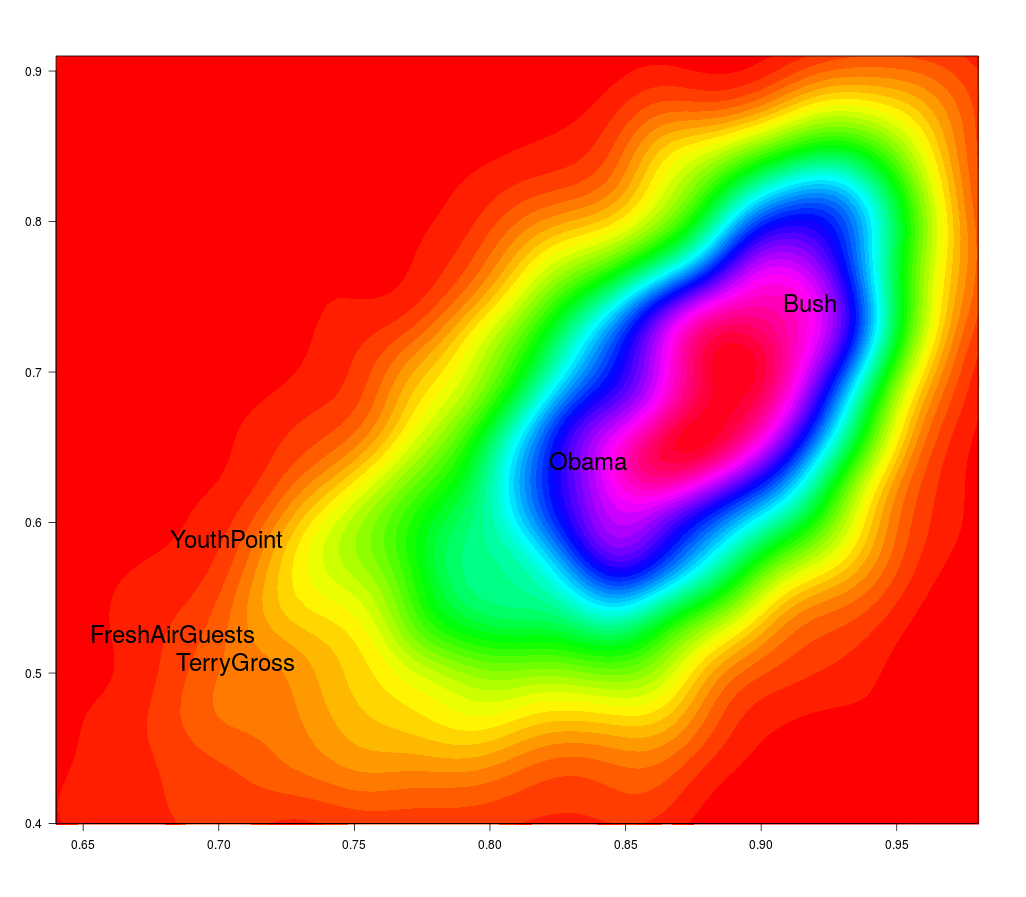
But a simpler approach is to set a duration threshold at some appropriate point, and ask what proportion of all the the segments are longer than that threshold. For the datasets we've been discussing, we get a plausible picture by setting the speech segment threshold at 600 milliseconds, and the silence segment threshold at 200 milliseconds.
This gives us two numbers for each of the 2,484 LibriSpeech speakers, and we can turn that 2,484-by-2 table into a two-dimensional density (again, basically a smoothed histogram), using R's kde2d() function. Now let's overlay, on the same plot, points for Obama, Bush, all of the YouthPoint speakers, Terry Gross, and all of the Fresh Air guests. What we see is that the two dimensions are highly correlated — and Bush and Obama span the modal area of LibriSpeech readers, while the spontaneous-speech datapoints are off on the low-percentage tail in both dimensions:
But not all dimensions of vocal performance line up so neatly with the read-vs.-spontaneous distinction. For example, if instead of the silence-duration measure we substitute a measure of pitch range, we see that on that dimension, read and spontaneous speech exemplars are thoroughly mixed, as we should expect them to be:
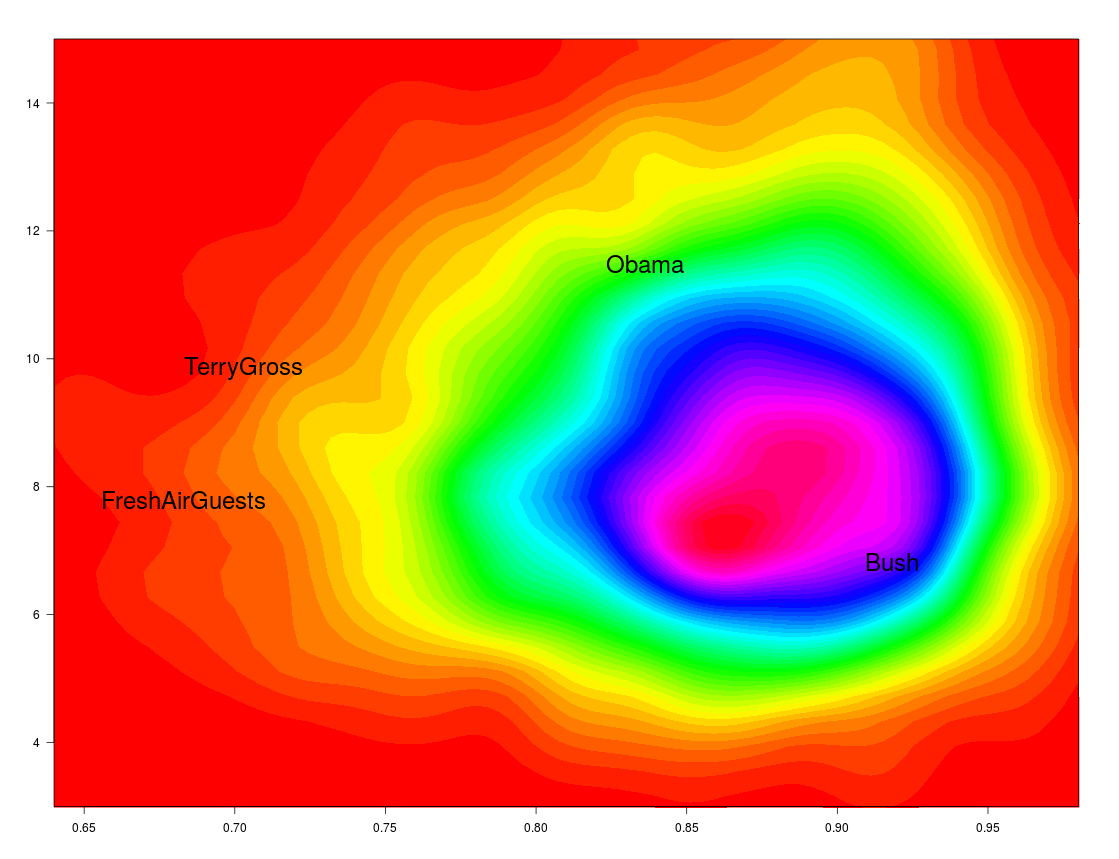
[To estimate pitch range, we used the smoothed output of a commonly-used f0 tracker, excluded all frames with an estimated probability of voicing below 0.9, and then calculated the difference between the 90th and 10th percentiles of the surviving estimates, expressed in semitones. Other plausible choices for the method's parameters would not change the overall picture in relevant ways.]
jk said,
April 9, 2016 @ 4:04 pm
Question: Is it certain that the Fresh Air recordings, at least, were not edited in ways that would affect these measurements, such as shortening some silences? That happens in some other public radio shows, as On the Media noted some years ago: http://www.wnyc.org/story/129437-pulling-back-the-curtain/
[(myl) This could certainly have happened. But also, in conversation, longer silences in general are likely to result in the other party jumping in.]
Agghtea said,
April 10, 2016 @ 4:16 am
Would love to see this with a broader range of politicians. The Obama and Bush distribution seem quite clear. I appreciate that there is probably not enough material to do a comparison between these and great speakers, but I'd bet they'd fall slap bang in between the two.
Yuval said,
April 10, 2016 @ 5:57 am
On the silence side, it seems the scripted samples hail from a very differently-parametered distribution, or perhaps from a different distribution family altogether: note how their modes are to the left of the spontaneous ones, but their masses lie to the right (as the directionality of the heatmap correlation seems to corroborate).
[(myl) The silence-duration distributions in general are well modeled as a mixture of gamma functions, including one well-defined mixture element with a relatively short mode, combined with one or more with longer modes. In the spontaneous-speech datasets that we looked at, the brief silences are longer than in the read-speech performances, but the longer silences tend to be somewhat shorter, and there are fewer of them in the mixture.]