Normalizing
« previous post | next post »
Alberto Acerbi , Vasileios Lampos, Philip Garnett, & R. Alexander Bentley, "The Expression of Emotions in 20th Century Books", PLOSOne 3/20/2013:
We report here trends in the usage of “mood” words, that is, words carrying emotional content, in 20th century English language books, using the data set provided by Google that includes word frequencies in roughly 4% of all books published up to the year 2008. We find evidence for distinct historical periods of positive and negative moods, underlain by a general decrease in the use of emotion-related words through time. Finally, we show that, in books, American English has become decidedly more “emotional” than British English in the last half-century, as a part of a more general increase of the stylistic divergence between the two variants of English language.
One odd thing about this interesting paper, as Jamie Pennebaker has pointed out to me, is described in the Methods section:
We obtained the time series of stemmed word frequencies via Google's Ngram tool (http://books.google.com/ngrams/datasets) in four distinct data sets: 1-grams English (combining both British and American English), 1-grams English Fiction (containing only fiction books), 1-grams American English, and 1-grams British English. […]
For each stemmed word we collected the amount of occurrences (case insensitive) in each year from 1900 to 2000 (both included). […]
Because the number of books scanned in the data set varies from year to year, to obtain frequencies for performing the analysis we normalized the yearly amount of occurrences using the occurrences, for each year, of the word “the”, which is considered as a reliable indicator of the total number of words in the data set. We preferred to normalize by the word “the”, rather than by the total number of words, to avoid the effect of the influx of data, special characters, etc. that may have come into books recently. The word “the” is about 5–6% of all words, and a good representative of real writing, and real sentences.
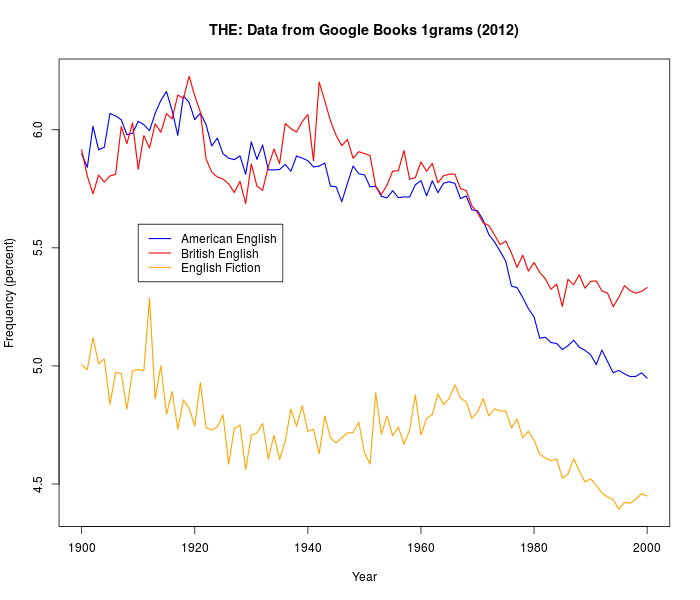
This matters, because the overall frequency of "the" is far from constant — here it is for Google Books' American English, British English, and English Fiction 1gram lists over the course of the 20th century:
Acerbi et al. suggest these significant differences among countries, genres, and times simply reflect "the effect of the influx of data, special characters, etc. that may have come into books recently" — and therefore normalizing by the counts gives a better picture of word frequency than normalizing by overall token counts. But in fact there's good reason to attribute a significant fraction of the differences in the frequency of the to real stylistic variation in the language, not just variation in the amount of "data, special characters, etc." in the Google Book sample.
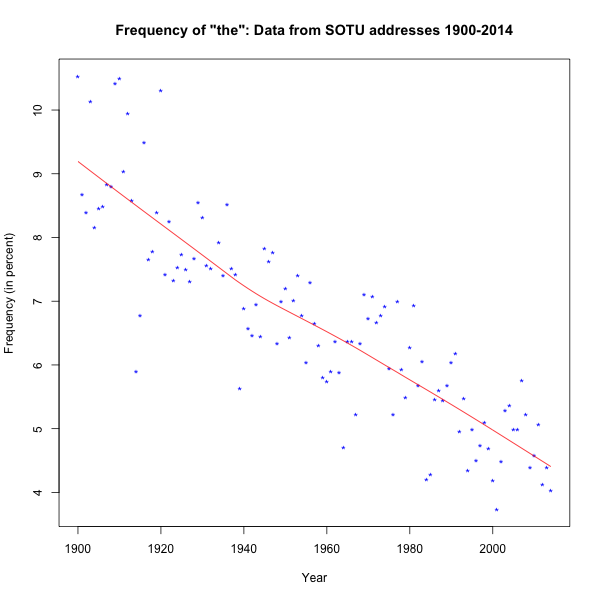
One piece of evidence is the fact that a similarly declining pattern can be seen in State of the Union addresses, as discussed in "SOTU evolution" (1/26/2014) and "Decreasing Definiteness" (1/8/2015):
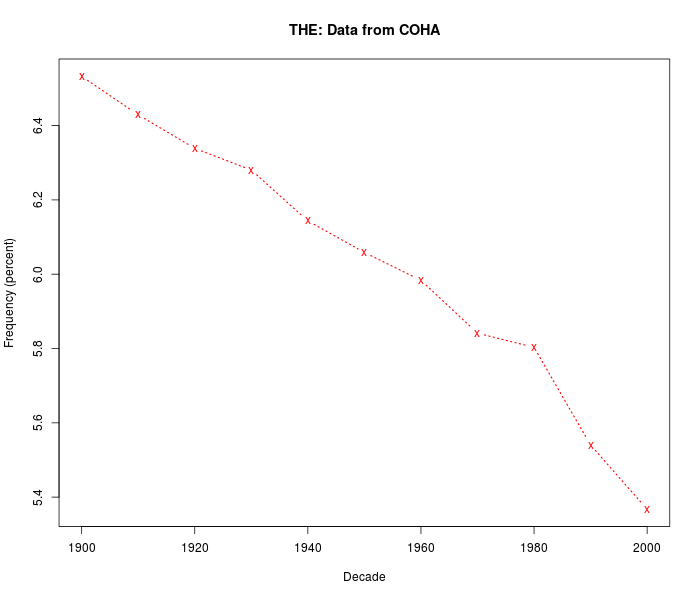
The same trend can be seen in data from the Corpus of Historical American English:
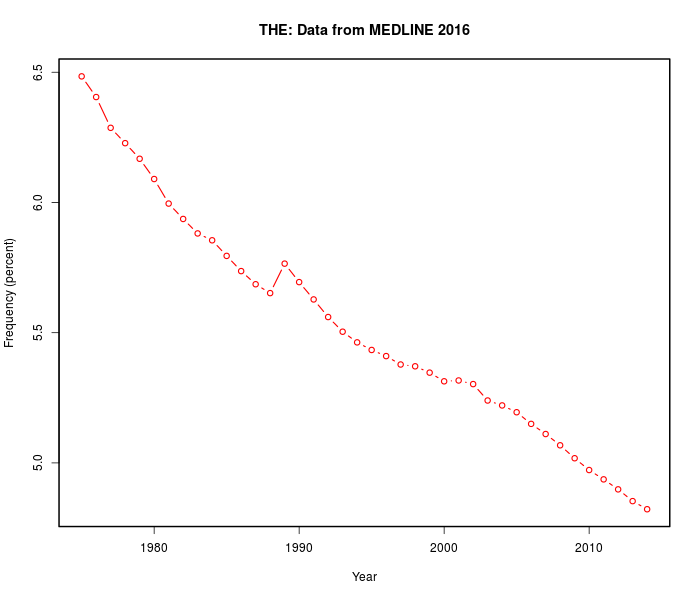
And as noted in "Positivity" (12/21/2015), something similar has been happening in MEDLINE text:
In "Why definiteness is decreasing, part 1" (1/9/2015), I presented some evidence that this is due to a secular trend in the direction of greater informality in the written language. In "Why definiteness is decreasing, part 2" (1/10/2015), I presented some evidence, based on age-grading, that a similar change is taking place in (American) conversational speech. And in "Why definiteness is decreasing, part 3" (1/18/2015), I tried to evaluate a suggestion (due to Jamie Pennebaker) that some part of the change might be caused by an increase the frequency of 's-genitives relative to of-genitives.
Whatever the causes of decreasing definiteness, it's clearly a real change in the language, not just a change in the publishing industry or in Google Books' sampling results. And so if you normalize the yearly counts of other words by the yearly counts of the, you're studying the evolution of the definite determiner (and formality, and …) as well as whatever other culturomic trends you're tying to trace.
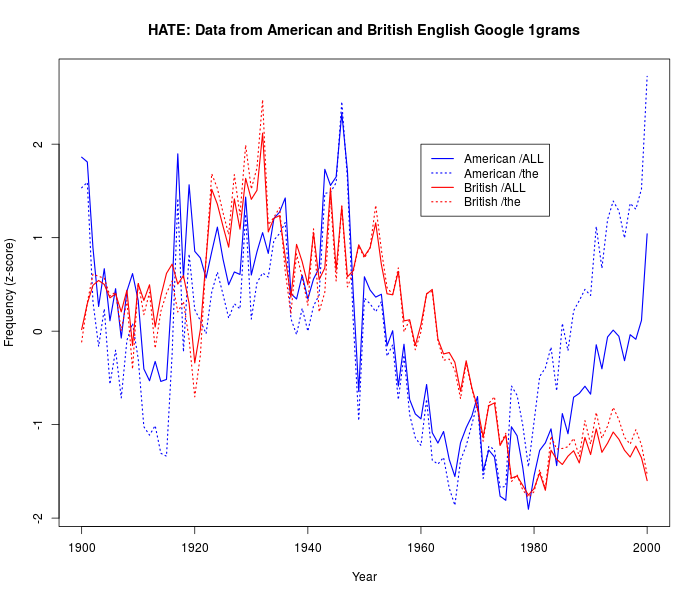
How much difference does it make? Well, I suspect that the claimed trans-Atlantic emotion gap ("American English has become decidedly more 'emotional' than British English") is (at least) exaggerated by the observed trans-Atlantic definiteness gap. I don't have time this morning to replicate the whole Acerbi et al. study, but here's a plot for (case-insensitive) forms of HATE (i.e. hate|hating|hates|hated|hater|haters), which shows exactly the predicted exaggeration of trans-Atlantic trends:
And I'd guess, in advance of investigation, that much of the post-1980 HATE boom in the U.S. is due to factors like the rise of terms such as hate speech and hate crime, as well a general bleaching of the word HATE towards mere disapproval, as in phrases like "I hate to say it" or "I hate to tell you".
So maybe the title of Philip Ball's Nature News article "Text mining uncovers British reserve and US emotion" (3/21/2015) should have been 'Text mining uncovers British formality and US informality".
Michael said,
December 31, 2015 @ 8:51 am
On the methodology: It seems elementary caution that if you're normalizing something and there's no established procedure for doing something, you'd test out your method first. Or at least, you'd try to provide some form of triangulation: so maybe "the" plus "an" (to avoid spurious uses of ) and maybe other potentially semantically neutral function words. If they all go in the same direction, you have a more solid basis for you're normalizing algorithm.
[(myl) In fairness, they do something like that:
To test the robustness of the normalization, we also performed the same analysis reported in Figure 1 (differences between z-scores (see below) for Joy and Sadness in the 1-grams English data set) using two alternative normalizations, namely the cumulative count of the top 10 most frequent words each year (Figure S2a), and the total counts of 1-grams as in [2] (Figure S2b). The resulting time series are higly correlated (see the legend of Figure S2), confirming the robustness of the normalization.
But if there were really no substantive difference, then they might as well use the more standard frequency measures — and as the graphs above show, there's a well-supported secular trend in the overall frequency of the, which is certain to affect their results to a substantial extent.]
Alberto said,
January 1, 2016 @ 12:50 pm
Hi,
I am one of the authors of the paper mentioned. First of all, thank you for your interest in our work. I wrote a blog post about normalisation problems with goole ngram, perhaps it can be relevant:
https://acerbialberto.wordpress.com/2013/04/14/normalisation-biases-in-google-ngram/
Consider I wrote this two years and a half ago, so it is not fresh in my mind anymore!
[(myl) Thanks! Your blog post certainly supports the argument that the Google Books ngram sample is not consistent across time. (The GB sample also has serious problems with OCR errors, as discussed in "Word String frequency distributions", 2/3/2013 — and it's likely that the frequency of such errors is different for books published at time different times.)
But it's also true that evidence from multiple sources confirms that the frequency of the has changed very substantially over the past century or so. And this effect is seen more strongly in the GB "American English" dataset than in the "British English" data set — though we don't know whether this is a difference in GB sampling or in regional language norms.
So the GB dataset is troublesome as a source of evidence about trans-Atlantic "culturomic" differences over time. And normalizing by counts of "the" risks making things worse rather than better.]
D.O. said,
January 1, 2016 @ 3:22 pm
If influx of data and special characters is viewed as important why not to have a go at the problem directly by counting all not-purely-alphabetic tokens?
[(myl) That's generally what I do in my own analyses. One problem however is that the GB OCR and tokenization are far from error-free, so that there are lots of "words" that incorporate (real or OCR-hallucinated) punctuation, numbers, etc. It's not easy to figure out how big a fraction of the total such cases are — and the proportion no doubt varies with the date of publication and the type of book — which dumps us right back in uncertainty about how much of an observed "trend" is real…]