A better way to calculate pitch range
« previous post | next post »
Today's topic is a simple solution to a complicated problem. The complicated problem is how to estimate "pitch range" in recordings of human speakers. As for the simple solution — wait and see.
You might think that the many differences between the perceptual variable of pitch and the physical variable of fundamental frequency ("f0") arise because perception is complicated and physics is simple. But if so, you'd be mostly wrong. The biggest problem is that physical f0 is a complex and often fundamentally incoherent concept. And even in the areas where f0 is well defined, f0 estimation (usually called "pitch tracking") is prone to errors.
The incoherence has several causes. To start with, any non-linear oscillating system is prone to period-doubling and transition to chaos, and the oscillation of human vocal folds is no exception. Human voices sometimes wobble on the boundary between two oscillatory regimes an octave apart, or fall into the chaotic oscillation known as "vocal fry". Add the fact that the larynx is a complex physical structure, so that in any given stretch of time, different regions of the vocal folds may be oscillating at different (mixtures of) frequencies. And then there are ("voiceless") regions of speech where the vocal folds are not oscillating at all, and regions where voicing is mixed with noise from turbulent airflow in the vocal tract.
Still, human voiced speech is generally intended to express a contour of pitches, rather than the mostly chaotic oscillation of flatulence or throat-clearing or a "bronx cheer". And we generally do a pretty good job of hearing the intended contour — transforming the octave uncertainties and the flirtations with chaos into perceptions of changing voice quality. For an illustrative example, take a look (and listen) at "Pitch contour perception", 8/28/2017.
Computer pitch-tracking algorithms try to use things like continuity constraints to prevent their estimates from jumping all over the place — but these techniques have their limits. And even when the vocal folds are oscillating in a well-behaved way that we could characterize in terms of a single fundamental period, pitch-tracking algorithms can make mistakes, due to noise, or vocal-tract resonances and anti-resonances, or just bad luck.
And unfortunately, because of the nature of the problem, the distribution of errors and uncertainties in pitch-tracking output is not a nice gaussian spread around a hypothetical truth, but rather a scatter of values that are 1/4, 1/2, 2, or 4 times what we might like them to be. (Because the main problem is period-doubling, pitch estimates are most often off by factors of 1/4 or 1/2.)
Phoneticians' traditional solution to this problem is to estimate a speaker's modal pitch range in the (portion of the) recording under study, and then restrict the pitch tracker to producing estimates in that range. This works well — but if the goal is to produce estimates of pitch range as a input variable for other research, it might seem to suffer from circularity. (I think this concern is largely misplaced, but it's an understandable one.)
I've tried to get past this problem using various complicated attempts at improved pitch tracking algorithms, mixture models of the resulting values, and so forth and so on. So far, none of these methods has worked reliably. Finally, it occurred to me to try something much simpler.
The idea is that the bottom of a speaker's modal pitch range is generally within a (musical) fifth or so of their modal f0 value. The top of the modal range is more variable, but also less crucial — something around 10 or 12 semitones is generally safe, because most of the higher values are "real". So if we run a pitch tracker, determine the modal f0 value in the output, estimate the boundaries of permitted values as between the mode minus a fifth and the mode plus a seventh, and then re-track using those limits, we should be good. I've tried this method out on data from TIMIT and various clinical datasets, and it seem to be reliable. I'll publish some code after I've had a chance to clean it up.
As a teaser, here's an example of the method applied to audio from the case where I found the biggest "creakometer" reading of anything I've looked at so far, namely Noam Chomsky interviewed by Ali G in 2006 ("And we have a winner…", 7/27/2015).
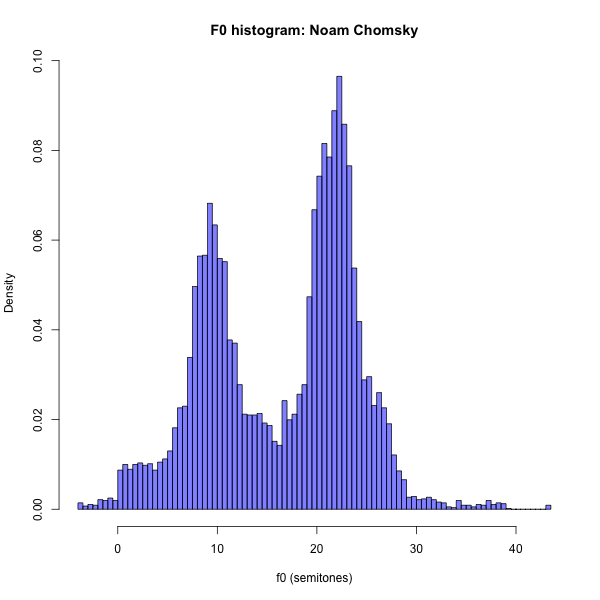
Here's Noam Chomsky's basic f0 distribution in that interview:

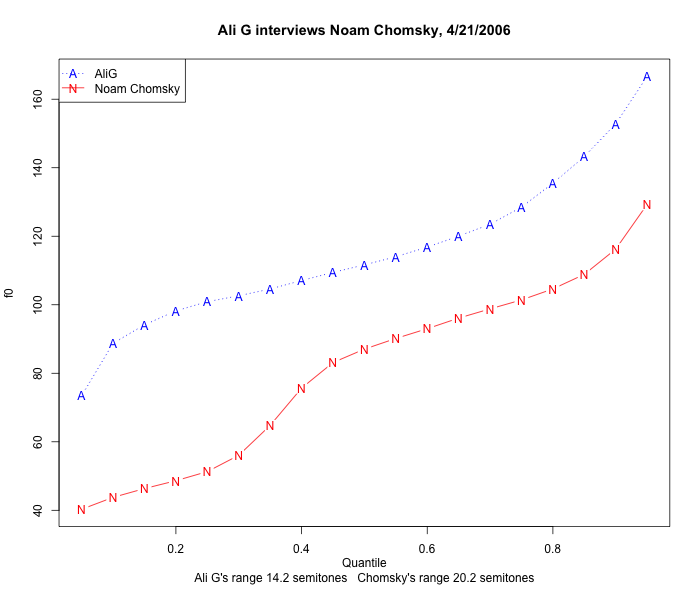
If we take the distance between the 95th percentile and the 5th percentile as a "safe" estimate of f0 range, we get a range of 20.2 semitones for Chomsky's contributions to that interview:

This is substantially larger than Ali G's range of 14.2 semitones as estimated by the same method, and if it really characterized the width of Chomsky's modal f0 range in this interview, it would represent a high level of vocal effort or physiological arousal. But of course what it really represents is the fact that more than 44% of his f0 estimates are an octave lower than his modal range — which listening to the interview will tell you is actually fairly narrow, as appropriate for his calm and relaxed demeanor.
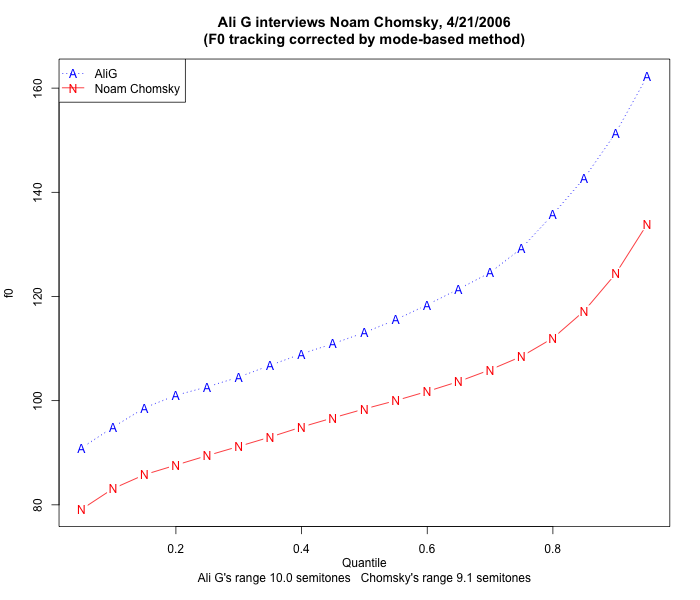
So I used the proposed method on both participants in that interview — estimating each speaker's modal distribution as running from their modal f0 value minus 7 semitones to their modal value plus 10 semitones, and running the pitch-tracking algorithm again with those limits. Now the quantitative estimate of Ali G's range (by the 95th percentile to 5th percentile method) contracts by 30% to 10 semitones — he also has a fair amount of vocal "creak" in his lower-pitch regions — while Chomsky's estimated range contracts by 54% to 9.1 semitones.
These estimates are much more consistent with perceptual impressions. And the resulting plot of quantiles lacks the low-end distortion representing the boundary between the two main pieces of each speaker's f0 distribution:
No doubt there are more sophisticated and effective ways to create and analyze f0 distributions. And of course there's information in creakometry. But this method seems to be a pretty good start at eliminating at least one of the sources of artifact in automated pitch-range estimation.

Y said,
November 26, 2018 @ 2:48 pm
Human voices sometimes wobble on the boundary between two oscillatory regimes an octave apart, or fall into the chaotic oscillation known as "vocal fry".
Isn't vocal fry manifested mostly as period-doubling, not chaos?
[(myl) No. The whole "fry" metaphor is based on the quasi-random popping of water-vapor bubbles in hot oil. See "Vocal creak and fry, exemplified", 2/7/2015; "What does 'vocal fry' mean?", 8/20/2015.]
Regarding your algorithm, would some languages have a wider tonal ranger in normal speech than your algorithm would accommodate?
[(myl) I doubt it. In the first place, as far as I know, differences in "tonal range" are cross-linguistically individual, situational, and cultural, not a fact about one language versus another. And the purpose of this simple-minded method is to isolate the modal region of what are clearly multi-modal distributions created by period-doubling — if the parameters of the (a fifth below the modal value and an octave above it) turn out to be inadequate for some cases, they could be modified. Or more likely, a different method should be used. But across several challenging datasets, this method seems to do about the right thing.]
Daniel Barkalow said,
November 26, 2018 @ 6:35 pm
It would be interesting to also try this on a sample where the speaker seems to use an unusually wide range and little creak (i.e., where that first histogram isn't bimodal), to see if that gets messed up. It might work best for both cases to collect an uncorrected histogram and then go back and reanalyze it if the first impression doesn't make sense.
[(myl) Can you suggest where to find a sample of the kind you recommend? In the collections I've looked at — for example, the SRI-FRTIV dataset — increases in pitch range due to increases in vocal effort generally scale approximately multiplicatively — like transposition to a higher musical range — so that the observed f0 span in semitones (which is a logarithmic scale) doesn't change very much. There are certainly circumstances that cause the modal distribution to broaden, but I haven't seen cases where the bottom of the modal distribution is more than 7 or 7.5 semitones below the mode, or the top of the modal distribution is more than 10 or 12 semitones about the mode.]
Søren SS said,
November 27, 2018 @ 4:23 am
Is this much different from excluding creak from the sample from the beginning?
[(myl) How would you recognize "creak" so as to exclude it? ]
D.O. said,
November 27, 2018 @ 2:42 pm
I am not doing any work with voice recordings and probably my comment will be a mixture of trivialities and non-sequiturs, but here goes.
How do we decide which frequency is a "base tone" and which one is double period modification in principle? For the base frequency, the harmonics go in the 1, 2, 3, 4, … progression (so that we don't need actually to observe 1, we can reconstruct it). If there is a period doubling, the harmonics will be 1/2, 1, 3/2, 2, 5/2, etc. So how can we tell them apart? The obvious answer is intensity. If energy in the integer harmonics is sufficiently larger than intensity in half-integer ones then we are dealing with period doubling event, if not, the "doubled period" became a dominant one and the true base frequency is 1/2. In that sense, true pitch depends on timber.
So here is my suggestion. Is it possible to track intensities in the harmonics of apparent f0 of Mr. Chomsky's speech and make a graph of the sum of even vs. odd (squared) intensities? It may tell us when we have an accidental undertone vs. when the tone truly shifts an octave down. Maybe it's not better than hard cut-off suggested by Prof. Liberman, but it might be more interesting. And, of course, it might not work at all.
[(myl) In a word, no. Go ahead and try it, and I think you'll find that such approaches can produce interesting results but don't even start to solve the problem. Period-doubling in the time domain is associated with frequency-halving in the frequency domain — in the time domain, we see alternative periods becoming gradually (or abruptly) more similar than those in between, while in the frequency domain, we see subharmonics gradually (or abruptly) appearing. See e.g. Hanspeter Herzel, "Bifurcations and Chaos in Voice Signals", 1993.
There are two general approaches to f0 estimation.
In a frequency-domain approach, we might try to identify the frequency of harmonics as you suggest (itself not a trivial matter) and then look for the greatest common divisor, or the relative amplitudes, or whatever. A problem with relative amplitudes is that from a perceptual point of view, missing fundamentals (and even cases where several of the first few harmonics are missing) are basically ignored, with the spacing of higher harmonics dominating the perception. A less fiddly frequency-domain method uses the ceptrum — the squared magnitude of the inverse Fourier transform of the logarithm of the squared magnitude of the Fourier transform of a signal — which was first used for that purpose in 1964.
The dominant time-domain approach — which is also the dominant approach to pitch determination these days — uses serial cross-correlation to identify the time lag at which the signal is most similar to itself. See here for some simple discussion.]
D.O. said,
November 27, 2018 @ 6:33 pm
OK, that was just a thought. I will look it up when I have time, but really using power spectrum or serial cross-correlation shouldn't matter because of the Wiener–Khinchin theorem.
Y said,
November 27, 2018 @ 10:46 pm
Mark, I can't reproduce your "bad" results. I downloaded the file, extracted the audio, and fed it to WaveSurfer (1.8.8p5). Of the total 10ms frames with f0 detected, about 4% were under 70 Hz for both speakers combined (I didn't separate the file by speaker). Your first quantile curve shows about 40% of NC's tokens under 70Hz, and about 0% of AG's, which should average to 20%, assuming both speakers got equal time. Moreover, the f0 plot in WaveSurfer seems well-behaved, unlike ones which regularly fail to track f0 (e.g. Praat). A spot check of some of the lower frequencies measured by WaveSurfer doesn't show anything odd, judging from the time between glottal pulses (e.g. the word "words" at 0m50s).
[(myl) What f0 limits did you use in WaveSurfer? I believe that the default is 60 to 400 Hz — and 60 is pretty much the lower limit of Chomsky's modal range (which my method estimated as 64 to 172 Hz), excluding nearly all of the lower-octave "creak" regions in his case. 60 to 400 Hz is OK for some adult male voices (which is why it's the default), but won't help in general with female voices, whose lower-octave distributions are generally well above 60 Hz, e.g. speaker FDFB0 from TIMIT:
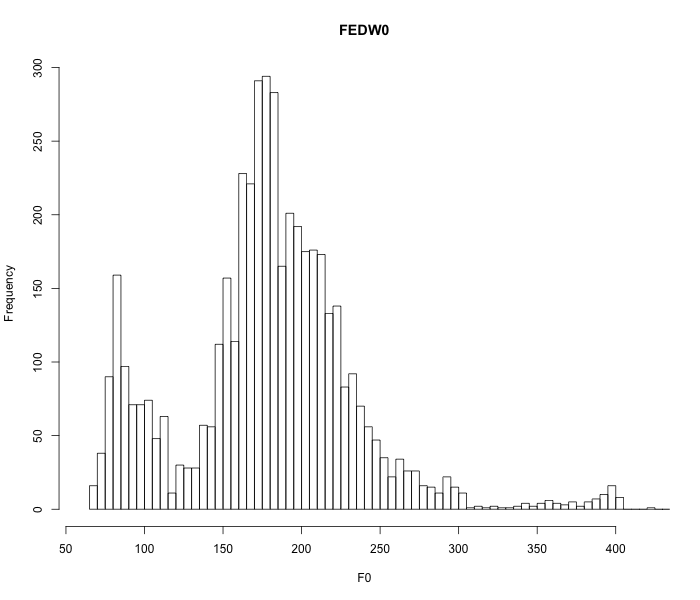
About 8.6% of her f0 values are in the lower-octave distribution, which is enough to significantly skew the bottom end of a quantile-based pitch-range calculation. Or TIMIT speaker FEDW0, whose f0 values are also all above 60 Hz, with 15.8% of them in the lower-octave distribution:

]
Philip Taylor said,
November 27, 2018 @ 11:25 pm
(OT) I had not heard/seen this recording before, but have to confess that I found Ali G's bilingual / multilingual / cunnilingual continuum hilarious …
Y said,
November 28, 2018 @ 9:37 am
I'd set the lower limit to 50Hz.
[(myl) If not 40 Hz, for some males with low-pitched voices. But for females with higher-pitched voices, the low end might be 120 or 150 or 180. The fact is that you need a custom range for each speaker, and even for each speaker in each context and mode of interaction — at least if you want to characterize parameters of the modal distribution rather than some quasi-artifactual mixture. ]
Y said,
November 28, 2018 @ 11:20 pm
I tried the Chomsky recordings with fmin = 20Hz and got a cumulative histogram similar to yours.
That said, I have an uneasy feeling about your heuristic, which relies on ad hoc limits (-7/+10 semitones or such). I also wonder if it would be effective with languages which use creaky voice.
(Then there's the matter of Yma Sumac's singing. The lower end of her seven-octave range is exuberantly creaky, at least in what I have heard.)