A note on those wiring diagrams
« previous post | next post »
 The paper that Geoff referred to a bit earlier today is Madhura Ingalhalikar et al., "Sex differences in the structural connectome of the human brain", PNAS 2013. It features a very impressive graphic showing sex differences in connectivity of regions within the brain, indicating a pattern where males (top row in the figure) "had greater within-hemispheric connectivity, as well as enhanced modularity and transitivity", whereas "between-hemispheric connectivity and cross-module participation predominated in females" (bottom row in the figure). This is argued to suggest that "male brains are structured to facilitate connectivity between perception and coordinated action, whereas female brains are designed to facilitate communication between analytical and intuitive processing modes".
Geoff linked to a letter from Rae Langton and John Dupré, which argues that "if the mind is the brain, any mental difference will be a brain difference", and that "training up half of humanity one way, half another" will inevitably create mental differences, which will correspond to brain differences, so that it's a mistake to see these results as necessarily a "deterministic fairy tale" about evolutionary biology, rather than a consequence of contemporary cultural differences.
This is all true, but I wonder whether something even simpler might be going on.
Specifically, I wonder whether the impressive-looking differences in connectivity might be mainly an artefact, caused by interaction between the way that authors measured and defined "connectivity", and the fact that women on average need to pack the same number of neurons as men into a smaller head. But in order to understand this idea, I'm afraid that you'll have to wade through a certain amount of background discussion.
The cited paper did not measure neural connectivity directly. Rather, the authors used "diffusion tensor imaging (DTI) to characterize WM architecture and underlying fiber tracts by exploiting the anisotropic water diffusion in WM".
Let's unpack this one piece at a time. Diffusion MRI, as Wikipedia explains, "allows the mapping of the diffusion process of molecules, mainly water, in biological tissues. Diffusion Tensor Imaging
… enables the measurement of the restricted diffusion of water in tissue in order to produce neural tract images. […] In DTI, each voxel has one or more pairs of parameters: a rate of diffusion and a preferred direction of diffusion—described in terms of three dimensional space—for which that parameter is valid. The properties of each voxel of a single DTI image is usually calculated by vector or tensor math from six or more different diffusion weighted acquisitions, each obtained with a different orientation of the diffusion sensitizing gradients. […] [T]he directional information can be exploited at a higher level of structure to select and follow neural tracts through the brain—a process called tractography.
A more precise statement of the image acquisition process is that the image-intensities at each position are attenuated, depending on the strength (b-value) and direction of the so-called magnetic diffusion gradient, as well as on the local microstructure in which the water molecules diffuse. The more attenuated the image is at a given position, the greater diffusion there is in the direction of the diffusion gradient. In order to measure the tissue's complete diffusion profile, one needs to repeat the MR scans, applying different directions (and possibly strengths) of the diffusion gradient for each scan.
"WM architecture" refers to the gross connectivity patterns of "white matter", which as Wikipedia explains
… consists mostly of glial cells and myelinated axons that transmit signals from one region of the cerebrum to another and between the cerebrum and lower brain centers. White matter tissue of the freshly cut brain appears pinkish white to the naked eye because myelin is composed largely of lipid tissue veined with capillaries. Its white color is due to its usual preservation in formaldehyde.
So "tractography" works because
The architecture of the axons in parallel bundles, and their myelin sheaths, facilitate the diffusion of the water molecules preferentially along their main direction. Such preferentially oriented diffusion is called anisotropic diffusion.
And here's how Ingalhalikar et al. calculated their "structural connectome" (SC):
The DTI for creating SCs was performed at a b value of 1,000 s/mm2 with 64 gradient directions on a Siemens 3T Verio scanner. Creating the SCs involved parcellating the brain into 95 regions (68 cortical and 27 subcortical) using a high-resolution T1 image, followed by interregional probabilistic fiber tractography, which provides the connection probability between regions, leading to the construction of the 95 x 95 network matrix called the SC of the brain (schematic in Fig. 1).
Here's the cited schematic:

The main point to take away from this, so far, is that we're dealing with a complex chain of inferences. It starts with local anisotropies of water diffusion, measured on a relatively gross spatial scale in 95 brain regions, each containing roughly a billion neurons on average. Then it chains these local anisotropies into a 95 x 95 matrix of "connection probabilities between regions".
So that striking sex-difference picture shows us the most important brain connections for males, versus the most important brain connections for females, right? No, not so fast. If you did that, the two pictures would look essentially identical. (The authors don't present that picture, but I'm willing to wager a substantial sum of money on how it would come out. And they've apparently deposited their data in a repository from which it will eventually be possible to retrieve it, so we'll be able to eventually to check whether I'd win my bet…)
Instead, as they note in the caption, that figure depicts
Brain networks [that] show increased connectivity in males (Upper) and females (Lower). […] Intrahemispheric connections are shown in blue, and interhemispheric connections are shown in orange. The depicted edges are those that survived permutation testing at P = 0.05.
And in the Materials and Methods section they say that
In comparing general connectivity between groups (here, males and females), we look for significant connection-based difference in the SC W. Each connection weight Pij was linearly regressed on age, sex, and age–sex interaction, and the resulting sex T statistic was used to construct the output T matrix (95 x 95). T was thresholded at positive and negative values to retain only those connections that are significantly stronger in either group. A positive Tij indicates higher connectivity in the males, and a negative Tij indicates higher connectivity in females.
In other words, they plotted that subset of the 95 x 95 = 9025 chained inter-region DTI-tractography connections that were (statistically) significantly more probable in males compared to females, or in females compared to males, using a permutation test to avoid multiple-comparison problems.
At least, that's how I interpret the paper. If I'm right, then so far this is just normal scientific marketing — – they've created an impressive figure that's likely to be misinterpreted by most readers, and they haven't gone out of their way to forestall this misinterpretation. Still, the figure is impressive, even on my interpretation of it.
But might it mean something very different from the interpretation that Ingalhalikar et al. put on it? Their suggested interpretation is that "male brains are structured to facilitate connectivity between perception and coordinated action, whereas female brains are designed to facilitate communication between analytical and intuitive processing modes".
But let's consider another possibility. (If you're impatient with detail, you might want to skip to the summary and conclusions below…)
As Ingalhalikar et al. themselves point out,
Males have larger crania, proportionate to their larger body size, and a higher percentage of white matter (WM), which contains myelinated axonal fibers, and cerebrospinal fluid (5), whereas women demonstrate a higher percentage of gray matter after correcting for intracranial volume effect (6).
The two cited papers are
5. Gur RC, et al. (1999) Sex differences in brain gray and white matter in healthy young adults: Correlations with cognitive performance. J Neurosci 19(10):4065–4072.
6. Goldstein JM, et al. (2001) Normal sexual dimorphism of the adult human brain assessed by in vivo magnetic resonance imaging. Cereb Cortex 11(6):490–497.
From Gur et al. 1999,
As expected, intracranial volume in milliliters (ml), consisting of parenchyma, ventricles, and sulci (without subarachnoid space), was (mean ± SD) higher for men (1352.2 ± 104.9) than for women (1154.4 ± 85.1): t = 9.26; df = 78;p < 0.0001. The difference (14.6%) falls between the difference in height (8.2%) and weight (18.7%). Total parenchymal volume was 1229.6 ± 106.2 (range, 1033.9–1469.4) in men and 1072.3 ± 71.5 (range, 895.4–1196.0) in women: t= 7.77; df = 78; p < 0.0001.
Note that if men were perfectly scaled-up women, volumetric differences would be expected to be 1.082^3 = 1.267, i.e. about 26.7% larger, rather than the observed 14.6% larger.
The measurements in Goldstein et al. 2001 are qualitatively similar:
| Men | Women | M/F Ratio | |
| Total cerebrum volume | 1113.1 | 1021.8 | 1.089 |
| Total cortex volume | 580.1 | 548.8 | 1.057 |
| Total cerebral white matter | 456.6 | 405.4 | 1.26 |
(The differences in between-sex proportions – 14.6% vs. 8.9% — are surprisingly large relative to the cited standard deviations. It's not clear whether this reflects differences in measurement techniques or differences in the subject population.)
Here's a table from Gur et al. 1999 with details of their measurements of white matter vs. grey matter:
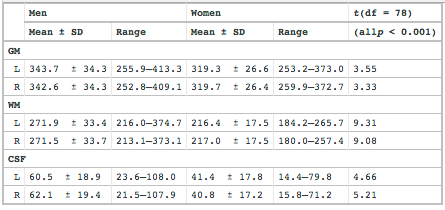
Expressing the mean grey matter and white matter values as male-to-female proportions:
| Left | Right | |
| Grey matter | 1.076 | 1.072 |
| White matter | 1.256 | 1.251 |
Here the differences between the two studies are smaller — both have 1.25 to 1.26 proportional difference in mean white-matter volume between males and females.
A more recent, and more complete, source of information on such things is the review in Tomáš Paus, "Sex differences in the human brain: a developmental perspective", Progress in Brain Research 2010. The fact that Paus looks at data on children and adolescents is especially relevant here, since the subject population for the Ingalhalikar et al. study has ages from 8 to 22, with an average of 14 or 15. Here's Paus's Figure 2, "Sex differences in global brain volumes":

Top row: Sex differences in brain size across 10 MR studies (see Table 1 for sample details and effect sizes). Bottom row: Sex differences in the volume of gray matter (empty symbols) and white matter (filled symbols) obtained in 9 of the 10 studies included above. A line connects gray and matter volumes obtained in the same study. M, male participants; F, female participants; PreMP Adults, pre-menopausal adults (20–49 years of age); PostMP Adults, post-menopausal adults (50+ years of age).
It's natural to ask whether these volumetric differences are mainly a matter of differences in the number of neurons, or differences in how the neurons are packed — and the answer seems to be that it's mostly the latter.
As Goldstein et al. note, "cell packing density, or number of neurons per unit volume", has been found to be greater in women than in men. They cite S.F. Witelson, "Women have greater density of neurons in posterior temporal cortex." J Neurosci 1995, who suggests that
The magnitude of 11% for the sex difference in NV [= number of neurons per unit volume] for the total cortex corresponds closely to the 10% sex difference in brain size. Such a result raises the hypothesis that one possible cause of the greater NV in women is a simple mechanical compression or geometric consequence of a smaller brain. The sex difference in brain size has generally been argued to have little biological significance on the basis of no sex differences in general cognitive abilities such as overall intelligence or memory (Halpern, 1992) and similar ratios of brain size to measures of body size in men and women (Gould, 1981). However, the assumption of an allometric relationship is undermined by the very low correlations between brain and body size variables within male and female groups (Peters, 1991), and also by the different pattern of sex differences observed for different cortical layers (discussed in a subsequent section). Cortical metabolic rate (expressed per unit volume) has been found to be greater in women than men in some PET studies (e.g., Hatazawa et al., 1987). Our results suggest that the greater NV in female cortex may contribute to this metabolic difference.
And with respect to white-matter sex differences, Paus 2010 notes (FA = "fractional anisotropy"; WM = "white matter"; DTI = "diffusion tensor imaging".):
FA […] reflects the degree of directionality of water diffusion; voxels containing water moving predominantly along a single direction have higher FA. In WM, FA is believed to depend on the microstructural features of fiber tracts, including the relative alignment of individual axons, their packing “density” (which affects the amount of interstitial water), axonal caliber, and myelin content. […]
[S]ex differences in WM, whether volumetric (based on T1W scans) or local (FA based on DTI), cannot be simply attributed to differences in the degree of myelination, as it is often assumed. We have suggested, for example, that age (and testosterone) related changes in the volume of WM during male adolescence are likely due to the increase in axonal caliber (Herve et al., 2009; Perrin et al., 2008); in general, sex differences in WM might reflect differences in the ratio between axonal caliber and fiber diameter (axonal caliber + myelin thickness), the so-called g ratio (Paus and Toro, 2009).
Adult male brains are on average about 10-15% bigger in volume than adult female brains. The mean difference in volume is smaller (6-8%) for "grey matter" (basically neuronal cell bodies, dendrites and unmyelinated axons, and glial cells — think "neurons"), and larger (25-27%) for "white matter" (glial cells and myelinated axons — think "longer-range connections"). The "cell packing density" of neurons in grey matter is on average about 10% greater in female compared to male brains, apparently representing the fact that a similar number of neurons are packed into a smaller space.
The much larger average sex difference in white-matter volume compared to grey-matter volume — which only emerges at puberty — appear to reflect a situation in which the numbers of myelinated axons are similar, just as the numbers of neuronal cell bodies are, but myelinated axons and their supporting tissues are more densely packed in post-pubertal females than in post-pubertal males.
In any case, as a result of these differences, what we might call the "statistical microarchitecture" of male and female brains is significantly different on average. This appears to be due to the need to package similar brains in smaller or larger heads.
Can we rule out the hypothesis that these differences are what's behind that striking picture of differences in inter-regional connectivity? I don't think we can. Maybe females' somewhat greater cell-packing density in grey matter makes it a bit harder to use DTI to follow water-diffusion anisotropy within hemispheres, while making it a bit easier to follow myelinated axons that jump through the corpus collosum to the other side. Maybe the much greater average white-matter volume in post-pubescent males (and the correspondingly lower axon-packing density) makes it a bit easier to follow within-hemisphere connections. And maybe these small differences accumulate to lead to an apparent sex difference in overall connectivity, which is actually driven by average sex differences in brain volume and cell density.
Or maybe it's really true that "male brains are structured to facilitate connectivity between perception and coordinated action, whereas female brains are designed to facilitate communication between analytical and intuitive processing modes" — whether it's evolution or socialization that's doing the structuring.
But my money's on the "artefact of size and axon packing" theory.
The paper's abstract says that
Data deposition: The data reported in this paper have been deposited in the dbGaP database, www.ncbi.nlm.nih.gov/gap (accession no. phs000607.v1.p1).
This is a welcome consequence of the U.S. Government's push towards open scientific data, cogently presented in John Holdren's 2/22/2013 memo "Increasing Access to the Results of Federally Funded Scientific Research".
Unfortunately, the data from this study doesn't yet show up at in the URL for the cited database as a whole, or at the link provided for the specific accession number, and in any case nothing from that accession number is yet available. But we can look forward to the dataset showing up there sooner or later — which should make it possible to evaluate some of the obvious alternative explanations for that fascinating picture.
Update – more here.
D.O. said,
December 15, 2013 @ 1:51 pm
I don't have access to the paper thus only able to speculate, but here' few thoughts
1) They subjects were 7 to 22 years old. Brain size has to correlate more with age then with sex in this range. If brain size is an issue, they should have resolved it somehow. At a minimum, we should be able to look at differences in "brain wiring" with age. This might be even more interesting than sex differences.
2) Reporting the difference and not reporting the average is a strange approach. There should be something in the paper that gives the estimate of the "average wiring".
3) If you are looking for explanation of men/women cognitive differences and the answer is different sizes of cerebrum than, ok, why not? Why is it better or worse than any other physiological explanation? The scientific question is, of course, what it really is (and you can never stop trying to throw the causality chain one link back), but "talking heads" issue does not actually depend on it.
4) Reaching reflexively for "nature" in (false) nature/nurture dichotomy is bad, but denying any possibility of physiological explanation for cognitive differences unless presented with an ironclad case is also not good. You cannot beat Siemens 3T Verio scanner with philosophical treatises. Better find some real arguments.
[(myl) A copy of the paper is here. For other empirical arguments, see the survey of the previous literature at the end of Christian Jarrett, "Getting in a Tangle Over Men's and Women's Brain Wiring", Wired 12/4/2013.]
John Roth said,
December 15, 2013 @ 2:04 pm
Actually, I'd like a good deal more of the back story on that research, but this is probably not the blog for that information. In particular, there were two IRB approvals: UPenn and the Children's Hospital, which together with the age cutoff and the rather anomalous demographics in Table 1 leads me to suspect that this is combined from at least two studies originally created for different purposes, one of which might be a typically WIERD university undergraduate cohort.
The other comment that leaps out is that, since many of the subjects were below the age where sexual dimorphism typically kicks in, discussions of brain volume and neuron packing might not have the weight we would give them from a study of adults.
[(myl) Good point, in that the experiment is really about "boys and girls" rather than "men and women", and development issues are almost surely relevant. But the subject pool was probably mostly post-puberty:
We present results from a cohort of 949 healthy subjects aged 8–22 y (mean ± SD = 15.11 ± 3.50 y), including 428 males (mean ±SD = 14.94 ± 3.54 y) and 521 females (mean ± SD = 15.25 ±3.47 y)
The picture for a "child group" taken separately does not show striking sex differences. "Adolescent" and "young adult" pictures are a bit more like the overall graphic, though it seems that the effects are quite a bit weaker:

It seems that the effects are small enough that the full nearly-1000-subject dataset is needed to see the striking "differences" shown in the widely-reproduced panel A (what I've shown at the top of the original post).
Also, as discussed here, there are a number of previous studies that have given quite different answers to what should be the same question…]
AntC said,
December 15, 2013 @ 3:34 pm
Hey, there's a language question buried in there:
T was thresholded at positive and negative values to retain only those connections that are significantly stronger in either group.
"thresholded"? "thresheld"?
I suppose I'm going to get ngrams to show that verbing that noun has a long history, but it jarred on my ears.
[(myl) Ngrams? The OED has an entry for threshold as a transitive verb, with citations back to 1968. And there's a patent for a "Randomly Pulsed Radio Ranging System", filed 12/30/1952, which includes these sentences (among others using the same verb):
The clipper circuit 15 delivers an output wave train 17 comprising a few pulses per second which are random in time. These thresholded pulses then are coupled to a monostable or "one-shot" multivibrator 19.
Going a few years further back, there's a patent for a "Pulse System" filed 8/4/1943, which explains that "In the receiver, the rectified, amplified, thresholded and limited received pulses are delivered to suitable demodulating circuits".
I suspect that people have been using threshold as a verb ever since developments in electronic circuitry made it logical to do so. And from a completely different direction, there's Philoctetes: A Metrical Drama (1871), by the implausibly-named John Byrne Leicester Warren, 3rd baron De Tabley, which includes these lines:
Thou, Philoctetes,
Unwilling colonist
Of rugged Lemnos, mother-land of mine;
She cannot feed the multitudinous
Flocks of the loamy mainland, poor indeed
And yet my country; whom the hoary deep
Sustains with scaly herds, whom pasture none
Delights, but the wave palaces
Of ocean weedy-thresholded —
Fallen art thou, my hero, such a plague
Hath Zeus devised.
]
Xmun said,
December 15, 2013 @ 5:06 pm
Forgive my quibble, but the PDF of the metrical drama reads "art thou", not "are thou", in the last line but one of your quotation.
[(myl) Thanks for the correction. Scribal error. But it's not a .pdf, is it?]
D.O. said,
December 15, 2013 @ 5:48 pm
I read the paper now (thank you, Prof. Liberman) and was not able to locate anything about their main results that is not the difference. Uh-oh. There is also not a word about within the sexes distributions. Not good again.
On the question of brain size maybe this is the answer
This should work if the density of neurons, or whatever is the real variable of interest in this case, is constant across the brain. Well, is it?
[(myl) The "real variable of interest" should be various properties related to the density and orientational anisotropy of myelinated axons. And the most relevant question, for understanding the origin of the sex differences found in this study, seems to me not to be whether these variables are constant across an individual's brain, but rather whether they are differently distributed in relevant ways in the children, adolescents and young adults in this study. According to Tomáš Paus, "Sex differences in the human brain: a developmental perspective", Progress in Brain Research 2010, the answer to this question seems to be that there are well-known developmental sex differences that might well lead to artefactual results in looking for sex differences in long-range tractography:
FA […] reflects the degree of directionality of water diffusion; voxels containing water moving predominantly along a single direction have higher FA. In WM, FA is believed to depend on the microstructural features of fiber tracts, including the relative alignment of individual axons, their packing “density” (which affects the amount of interstitial water), axonal caliber, and myelin content. […]
[S]ex differences in WM, whether volumetric (based on T1W scans) or local (FA based on DTI), cannot be simply attributed to differences in the degree of myelination, as it is often assumed. We have suggested, for example, that age (and testosterone) related changes in the volume of WM during male adolescence are likely due to the increase in axonal caliber (Herve et al., 2009; Perrin et al., 2008); in general, sex differences in WM might reflect differences in the ratio between axonal caliber and fiber diameter (axonal caliber + myelin thickness), the so-called g ratio (Paus and Toro, 2009).
(WM = "white matter"; FA = "fractional anisotropy"; DTI = "diffusion tensor imaging".) ]
Chris said,
December 18, 2013 @ 5:05 pm
Apologies if the subthread I'm contributing to is deprecated as a threadjack, but ISTM that "weedy-thresholded" doesn't constitute use of "threshold" as a verb any more than "long-haired" constitutes use of "hair" as a verb, or "redheaded" constitutes use of "head" as a verb (of course "head" can be a verb, but "redheaded" is only distantly related, although both derive ultimately from the noun "head").
Although I don't know precisely how to characterize the construction in question, it seems to me to at most superficially resemble containing a verb.
Dropping the adjective increases the similarity to a participle, but doesn't change the principle, I think. A horse is only saddled if someone has saddled it, but if a man is bearded, it doesn't necessarily mean anyone has bearded him (although they might have) — the connection to corresponding verbs, when it exists at all, is merely coincidental.
P.S. As for the original topic, did the researchers take any notice of the fact that if you test 9000 potential correlations at the p=.05 level, you can expect a couple hundred false positives as a matter of routine? I'm not a trained statistician or anything, but if that can occur to a mere layperson, it surely ought to have occurred to them and/or their reviewers…
Mike Maxwell said,
December 21, 2013 @ 10:42 pm
Re AntC's question, I thought at first that he was asking why the passive participle of the verb "threshold" was "thresholded" rather than "thresheld." It took me several readings to realize that he was also? instead? asking whether it was really a verb.
I guess the participle form is related to the fact that the word does not come (as I thought it did until I looked up its etymology just now) from "thresh" + "hold". Which explains why it's not spelled *threshhold, which I have also wondered.
I guess I can say that I have now been learned.