NYT word frequency data
« previous post | next post »
[Update — apparently the data for the graphs presented by Sabeti and Miller came originally (without attribution) from work by David Rozado, who has provided useful information about his sources and methods. I therefore withdraw the suggestion that the counts were wrong, pending further study, though I am still not persuaded by the arguments that Sabeti and Miller used their version of his graphs to make.]
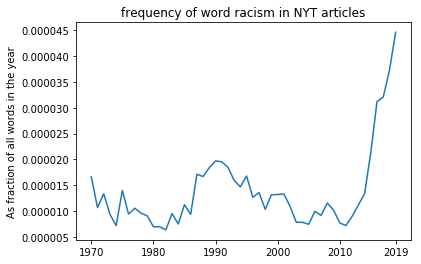
This is the subgraph for "racism" from the display originally presented in John F Miller's 2019 tweet, reproduced a few days ago by Arram Sabeti, and allegedly representing "New York Times Word Usage Frequency (1970 to 2018)":
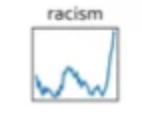
Earlier today ("Sabeti on NYT bias"), I lodged some objections to Miller's graphs, especially the way that the y-axis scaling misrepresents the relative frequency of the various words and phrases covered. But after looking into things a little further, I find that it's not just a scaling problem — the underlying number sequences in Miller's graphs are substantially different from what I find in a search of the NYT archive, at least in the cases that I've checked. I don't know whether this is because of some issue with Miller's numbers, or with the counts from the NYT archive, or what. But for whatever reason, Miller's numbers are (in all cases where I've checked) seriously at variance with the results of NYT archive search.
And the differences make a difference — Miller's tendentious conclusion that "social liberal media and academia are wilfully gaslighting people" is even less well supported by the Archive's numbers than it was by the original misleadingly-scaled graphs.
I'm going to present just one case.
Here is a page whose links will take you to the NYT archive searches for the word "racism" in each year from 1970 to 2019.
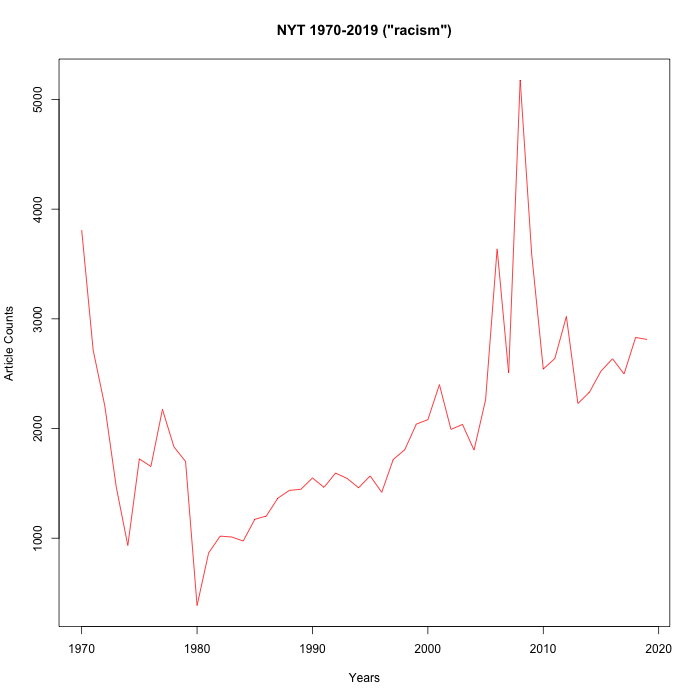
Here are the yearly counts 1970-2019, derived from those searches.
Here is a simple R script for graphing those numbers.
And here's the resulting graph:
As you can see, quite apart from axis scaling, this is not the same sequence as the one depicted in Miller's graph:

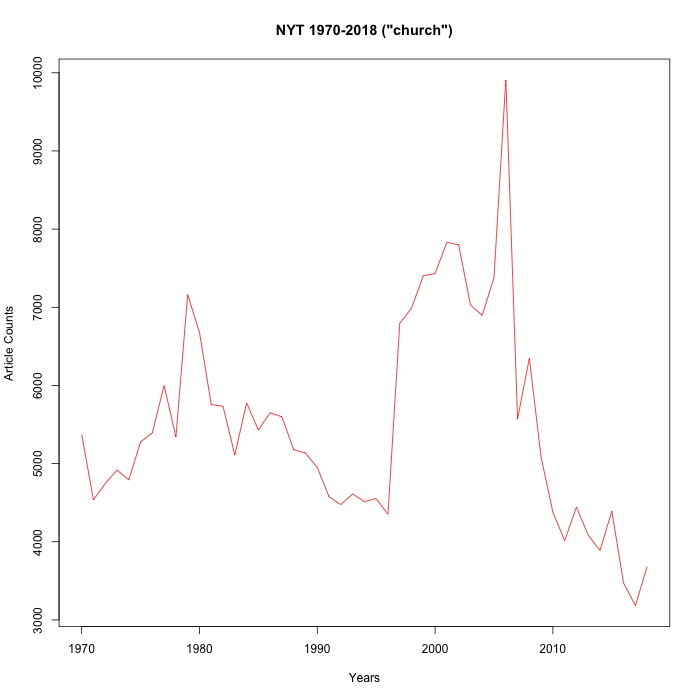
OK, two cases… Here's the same stuff for the word "church" — links, counts, R script, graph:
And Miller's graph to compare:
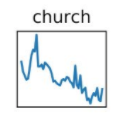
I haven't rechecked all of Miller's words and phrases, but the ones that I've looked at all have similar problems. The sequences as presented in his graphs are clearly different from the counts given by NYT archive search. And the true sequences (or at least the results from the NYT archive) generally differ from Miller's graphs in ways that undermine his conclusions.
Bruce Rusk said,
August 2, 2020 @ 6:53 pm
Is it just my brain pattern fitting or are the two sets of graphs almost mirror images? The peaks and valleys look to be be roughly where they would be if the x axis were flipped. As if the datasets were slightly different (using a different set of sections, for instance), or the smoothing were done a little differently?
Viseguy said,
August 2, 2020 @ 7:14 pm
It takes me a while to absorb numbers/graphs, but what jumped out at me on a first read was: "Here is a page that whose links will …". What went through my head was: The that avoids the "which" hunt, but I can still hear Sister Mary Esther's voice in my head insisting that an inanimate object can't "take" who, whom, or whose. I am heartily sorry, myl; I'll go back now and try to absorb the main point of your post.
[(myl) Glad to see that my standing as one of the world's worst proofreaders is intact… And thanks for catching the mistake.]
David Rozado said,
August 2, 2020 @ 10:16 pm
I am the author of the figure you are discussing. I estimated the frequency counts for target words by counting how many times the word appears in the headline and main body of text of the article. In the attached file you can find the counts of the target word "racism" that Mr. Liebermann claims to have "debunked" and the URLs pointing to the location of the articles where it appears. Anyone can verify that the counts per article match. Also, if the counts are aggregated by year, the plot below is easily reproducible.
plot:
https://ln2.sync.com/dl/a58725cb0#dvn4s5rv-7hr5xw34-rsx46a3a-jnk4c24v
data:
https://ln2.sync.com/dl/78b86faa0/view/default/6364402190014#uj2a6t68-pzynvcza-4iwk39vd-y5g34mp6
[(myl) If you're the source of the table of graphs used by Sabeti and Miller, they've done you a disservice by presenting the picture without any attribution, or any explanation of how the graphs were constructed. Thanks for making your data and methods available — I wish Sabeti and Miller had pointed to your work, and to the files you've supplied. Were they published or referenced in any way before?
I'm still puzzled as to why your word-count numbers are so different from the article-count numbers from the NYT archive search — it's good to have the start of a basis for resolving the discrepancy. It may very well be the case that the NYT archive search is misleading.
But I remain convinced that the y-axis scaling, in the plots borrowed (without attribution) by Sabeti and Miller, is misleading, for the reasons laid out in my earlier post.
In the table of graphs used by Sabeti and Miller, there's no y-axis label, but the scale runs from 0 to 1, which is strikingly different from the scale (and label) in the graph you've just supplied, which runs from 0 to 0.000045:
As I argued, the 0-1 scaling leads to the implication that (say) discussions of "church" and "duties" have been replaced by discussions of things like "toxic masculinity", which is misleading since there's two orders of magnitude difference in their relative frequency.
One more request: can you tell us how you got the list of article URLs by year that you present in your csv files?
Did you scrape the whole NYT archive, or get the data from somewhere else? And thanks again for the information that you've provided. ]
David Rozado said,
August 2, 2020 @ 10:20 pm
I also provide counts of total number of words in all articles for all years so frequency counts of a target word can be normalized and take into account increasing volume of article production.
https://ln2.sync.com/dl/1a5511e80#965b5bw9-uwq78rxr-tnpn5fhz-xr2sjqyd
Whether we feature scale to the 0-1 range or plot the frequency of target word as percentage of all words in all articles in the year does not make a big difference in this trend.
The rest of the counts for other words that I am investigating in several news media outlets, not only the NYT, will be released in an upcoming journal article.
To provide further validity for my frequency metrics, my trends agree with what others have found using the LexisNexis database.
https://twitter.com/ZachG932/status/1133536421329952769
Albeit, LexisNexis metric is number of articles mentioning the target word, instead of frequency of the word as a percentage of all words in a year (which is the count I use), but the trends are very similar. The only 2 caveat with the figure: I have no idea how LexisNexis algorithm works, perhaps they include figure captions, sub headlines, etc from an article. I don't. But regardless, the trends are highly similar. Also, I could not estimate proper frequency counts for 1980 so for that year I simply backward filled from 1981 to have continuity in the time series.
I'm shocked at how carelessly Mr. Liebermann throws around accusations of bogus data with a flimsy amount of effort on his part to "replicate" other people's results. I have spent years on this project. Mr. Liebermann here puts a few hours of effort to rationalize to himself his "debunking" of a figure he dislikes and then he happily accuses the data of being bogus. I think this behavior is very poor form coming from a senior academic. I have no idea how the NYT search engine works and how they estimate frequency counts, but I'm not just going to accuse them of bogus data if I don't like the trends their tool provides and even less taking to social media to do that.
For my part, both the data I provided above and that anyone can verify and the agreement of my frequency counts with LexisNexis give me sufficient confidence about the validity of the frequency counts I estimated.
Furthermore, when one uses control words, such as Bush, my tool generates results that most reasonable people would agree make sense. Look at the peaks on the frequency of the word Bush for the two presidencies of Bush Senior and son.
plot:
https://ln2.sync.com/dl/3d37c1160#pp7b6e2h-4diddkgk-i35u6fyf-aeffku2p
data:
https://ln2.sync.com/dl/cecdebc20#9ehmr3xc-8gegnunh-jq87uqc6-pq72texh
If Mr. Liebermann had concerns about the validity of the trends, he should have spent some time trying to reach out to the author of the figure, rather than taking to social media to claim that the data is bogus. I would have been happy to have an academic conversation with Mr. Liebermann about my statistical metrics, show him the methodology in detail, even share statistical metrics with him, as I have done with dozens of academics that have reached out to me in good faith with questions about the figure.
djw said,
August 2, 2020 @ 10:27 pm
Viseguy, check your dictionary and forgive Sister Mary Esther; she was teaching what she believed, which in the case of inanimate "whose" was inaccurate.
~flow said,
August 3, 2020 @ 3:24 am
Just a few observations:
* when pointing out that the Rozado/Sabeti curves do not match NYT archives data, how can we be sure the latter is in fact more accurate? I suggest that as long we do not have a third independent source—like a study that recounted materials published NYT—we do not know whether some stupid error in their aggregation logic (or maybe the way that singulars and plurals or conjugated forms are/aren't lumped together, or they ways that types of articles are considered or discarded for the counts), we cannot be very sure the NYT data accurately reflects their own publication activity.
* I have not so much difficulty with the charts being normalized on the Y axis (the X axis seems to be uniformly 1970–2018). This has been done before with other kinds of data (e.g. stock market, the current epidemic), and there are probably a few reservations that should be made WTR to this presentation form, but otherwise, we frequently do it informally, all the time: "Oranges were sold twice as much as last years, while apples dropped to half of their sales they saw last season." OK not quite: actually the informal statement here is better than the tendency graphs because the latter are not anchored to the bottom, meaning that any few mentions of an otherwise unheard-of term will always cause a full zero-to-full spike on the normalized graphs. IOW the graphs are extremely sensitive for words with few overall appearances. But the alternative—graphs anchored to zero, which is best-practice—has the trouble that with vastly diverging counts, not-so-frequent words get drowned by a few prevalent ones. What can you do?
* I have big difficulties with the ready interpretation of the 'sparklines' as has been presented on Twitter and elsewhere. Somehow many chiming in seems to have been lurking out there for a considerable time just to come forward and retweet "Yes! THIS!", and they seem to be seeing things in the data that I can't see. Somehow there appears to be an unspoken underlying assumption that even so much as mentioning certain topics in society turns a paper into a socialist propaganda outlet. The NYT could write "X is totally awesome" or else "X is totally troublesome" all they want, in these graphs we would see an uptick for term X all the same. They could also remain silent on X just to avoid people discussing them but that would make them more like Stampcollector's Weekly than a newspaper. Another observation is that more than a few comments state that some of the terms 'weren't even a word a few years ago' without making entirely clear what that tells them.
* As an additional thought, there a very few control words in the vocabulary as chosen for the presentation. There is, curiously, 'China' (trending up) and 'general motors' (sic; trending down), but little else of the many things one could have talked about in the 48 years covered by the data. Generic words ('future') are as absent as more specific ones ('Falkland'). What *is* shown is words pertaining to a discussion of human rights but, again, 'human rights' is absent. As such, by concentrating on 'loaded terms' and omitting sources, methodologies, word count base lines and control words, the OP of the charts does in effect little more than throw out a ten-by-ten grid of vocabulary peppered with allegations. The OP even starts his rant with the words "Knowing what I know", which does not betray a careful analyst's voice. To his credit, he follows up with more charts from other sources that I will not go into here.
* Thankfully, there are thoughtful comments as well: "If you run searches of right-wing media or left-wing media you're likely to get similar charts: these are zeitgeisty phrases. They don't mean what you seem to be saying." writes one; "This is a ton of confirmation bias and trying to see things in the data that isn’t there." writes another.
Bloix said,
August 3, 2020 @ 7:24 am
Sabeti's allegation of bias is incoherent. The cases of "harassment" of Weiss and 'Scott Anderson' were allegedly attacks on moderates by ideological leftists. The help in getting Trump elected (which IMHO did happen) was a case of the Times running after shiny pennies given to them by insider leakers at the FBI who didn't want HRC elected. So Sabeti is alleging bias to the left and bias to the right, meaning whatever the data is, it will prove his allegations.
Jerry Friedman said,
August 3, 2020 @ 7:25 am
Out of curiosity, I looked at one of the articles from 1970 in Prof. Liberman's set of links to uses of "racism". Though the article is about a plan to integrate housing in the Dayton, Ohio, area, neither "racism" nor any plausible error for it in that article.
https://www.nytimes.com/1970/12/21/archives/suburbs-accept-poor-in-ohio-housing-plan-illustrates-a-pattern.html?searchResultPosition=2
I looked at one other article from the list. It's about what the URL says. Unsurprisingly, "racism" does not occur in it.
https://www.nytimes.com/1971/12/21/archives/aclu-suit-fights-federal-dismissals-for-homosexuality.html?searchResultPosition=1
So maybe the problem is indeed with the NYT archives (unless I'm misunderstanding what Mark Liberman is doing).
[(myl) There's definitely an issue with the NYT Archive search, which obviously is what I used to get the numbers in my graphs. You can see from the (program-generated) URLs what the searches are. It's not clear to me what the problem is and how seriously it affects those numbers. I'm hoping to learn what method David Rozado used to generate lists of article URLs per year.]
Andrew Usher said,
August 3, 2020 @ 7:47 am
No, it is not incoherent to allege at one time bias toward the 'left' and at another time toward the 'right'. Even if the Times were one monolithic mind, it would not be out of the question for that mind to sometimes agree with the 'left' and sometimes with the 'right' – or someone on the 'left' could actually want Trump elected for strategic reasons. But I imagine an extreme partisan warrior like you would not see those possibilities. Other posters were generally trying to keep personal politics out of it, until you show up.
A fundamental question that seems obvious is: can you ever use word frequencies as a proof of bias? It seems to me that assumptions will necesssarily have to enter into it; even if you went into analysis about _how_ the word was used in each case, there'd still be room for argument, etc.
But even ignoring that, I have to agree that the data don't amount to much when there's such a huge hole creating opportunity for bias. We know that in these cases even a relatively honest experimenter will tend to select the examples that seem to prove his case and reject those that don't. While I don't say that they are free of bias (obviously), this from what I see here does not really add to the case.
Rodger C said,
August 3, 2020 @ 8:28 am
Viseguy, what did Sister tell you to use for an inanimate possessive instead of "whose"? "Which's"?
And Mr. Rozado, you're not addressing anyone named Liebermann.
Jerry Friedman said,
August 3, 2020 @ 9:31 am
Rodger C: I'm sure Sister preferred "that's" on descriptive grounds, since it's more common. COCA doesn't have any relevant example of "which's", but it has, probably among others:
Once, I wrote a song that's chords were based on a fan in one of my high school's bathrooms.
Could you imagine using a phone that's navigation didn't work?
"I felt like this book that's intentions were artistic had become something else."
They then analyzed the fishes' RNA during separate developmental stages, searching for a gene that's expression triggered development along each trajectory.
Adrian Bailey said,
August 3, 2020 @ 1:46 pm
Mr Rozado's (short) Twitter feed contains dozens more of his misleading little graphs.
It'd be inteesting to read his paper. https://link.springer.com/article/10.1007/s12129-019-09857-7
btw I notice that he (or someone else at Otago Poly) has taken the NYT analytics tool (media-analytics.ict.op.ac.nz) offline. but his US-universities one is still available: nlp.op-bit.nz/about
David Rozado said,
August 3, 2020 @ 3:37 pm
Rodger C, I use speech recognition software to type, it constantly misspells Liberman to Liebermann
Adrian Bailey, I took down the site because some people were abusing the system by generating thousands of HTTP requests per second which would bring down the server and became a hassle for me to take care of.
David Rozado said,
August 3, 2020 @ 3:47 pm
I think y-axis 0-1 feature scaling is appropriate to determine whether different words are being used more or less over time. Using absolute counts is not appropriate since the frequency of different words varies so much that high-frequency words (i.e. car) would dwarf any pattern in a low-frequency word (i.e. retinopathy). Obviously, to compare directly the prevalence of two related terms of similar volume of counts, absolute counts are more appropriate.
Viseguy said,
August 3, 2020 @ 9:48 pm
@djw: I checked my dictionaries and grammars long ago, and long ago forgave the good Sisters of St. Dominic for teaching me what they believed. In fact, I thank them regularly, in pectore, for having given me a structured, disciplined way of thinking about the English language and how to deploy it, especially in writing. When I got to college, Bill Labov and his reel-to-reel audiotapes freed me from any Latinate excesses the Sisters had imparted. (Except split infinitives. I was constitutionally unable to split an infinitive until a few years ago.)
@Rodger C:
> what did Sister tell you to use for an inanimate possessive instead of "whose"?
> "Which's"?
Sister wasn't an idiot — when I was in 4th or 5th grade, she was going for her doctorate in theology, very much an R.C. male preserve in the 1950s. No, she told us to use "of which" for inanimate possessives: she would have marked up Professor Leebermann's emendation to read, "Here is a page the links of which will take you to …." In bright red ink, no less, the traumatic effects thereof be damned … um, darned.
~flow said,
August 4, 2020 @ 2:46 am
@David Rozado As for showing the trend, normalizing (scaling) word frequencies should be OK, and you're right that when comparing a frequent word with a not-so frequent word the former will often just reduce the curve of the latter to a more or less straight line near zero. This is somewhat related to but different from the question whether or not to pull up the zero ordinate up so as to highlight changes (shifting), a practice that seems to be prevalent in discussions of stock market trends and is regularly and rightly criticized whenever it finds it way into news intended for a more general audience. The problem with normalization is of course that any smallest change will, by definition, look as big as the most monumental one. In the past, this has often be abused (a recent example being the POTUS bringing forward a curve apparently showing a huge market uptake which, when properly scaled and put into context, turned out to be a minor blimp in a whole nother trend). Don't be that guy.
There's one alternative way to treat trending data which is to acknowledge that disparate data is disparate, so each curve needs its own scale. What one can do is to arbitrarily define a set date—often but not necessarily the oldest one shown, so 1970 in this case—and then display percentages for each curve. This method *could* turn out to just show straight lines for many words, but that's a result, too. I once had a client that wanted to talk me into shift-scale one of two curves to more clearly show a trend that he believed that was there. It was very hard to convince him that the trend, while there in principle, was microscopic, to no avail—he believed in it, so to him it was just a matter of finding a competent graphic designer to express that belief in the form of a curve on a chart. He would not take no as an answer. Don't be that guy. No means no.
Philip Taylor said,
August 4, 2020 @ 3:34 am
Viseguy — I never had the benefit of the good Sister's instruction, but for me "of which " is nonetheless by far the most natural and elegant way to express an inanimate possessive, and I inwardly wince whenever I read something that could better have been expressed using "of …" expressed instead using a more direct, but considerably less elegant, construct. Incidentally, we [Britons], as you may be aware, don't share the American obsession with the « wicked 'which' », despite the fact that Don Knuth (see page 3) blamed Fowler (a Briton) for formulating the rule in the first place !
I note, by that way, that your constitutional inability to split infinitives still leaves a resonance in your psyche, as it does in mine — had it not, you might well have written "I was […] unable to ever split an infinitive until a few years ago" …
Jerry Friedman said,
August 4, 2020 @ 2:19 pm
Philip Taylor: I'd guess that a sizable majority of Americans never give a moment's thought to the that-which distinction you're talking about. However, some editors here enforce it.
chris said,
August 4, 2020 @ 7:35 pm
A fundamental question that seems obvious is: can you ever use word frequencies as a proof of bias?
ISTM that the type of mechanistic approaches being discussed here can't even distinguish a use from a mention, so even if the word is something extremely loaded like "feminazi", you won't know whether the article is sincerely condemning someone as one, ironically anticipating that someone else will use the label, lamenting its coinage and use as a milestone in the decline of civility, or something else entirely.
Rush Limbaugh's political biases are well known but not everyone who uses (let alone mentions) one of his coinages shares them. And it gets even murkier for terms that aren't as loaded.
If the NYT has genuinely been discussing both "gay rights" and "homophobia" more often over time, does that tell you anything about whether they favor one over the other, and if so, which?
One thing that does seem to be true from these data (to the extent they can be trusted at all) is that quite a few of the terms selected by Sabeti spike very recently, i.e., the NYT almost never discussed them until the last several years. Presumably the graph for "COVID-19" would be even more dramatic.
For recent coinages, I would expect any other publication to show a spike close to the same time, a comparison that doesn't seem to have occurred to Sabeti. "Multiculturalism" seems to show a well-defined sudden jump up from 0 at a specific time in the 80s (I think — unlabeled axes). But is that specifically the NYT that abruptly started discussing multiculturalism that year, or was there an actual newsworthy event that started more widespread discussion about it? It is, after all, the NYT's business to report on the actions and sometimes the words of other public figures.
Changing taboos are another possible explanation — obviously people have been talking about sex long before 1970, just usually not in the NYT. But the fact that the NYT is discussing sex more doesn't prove whether they're for it or against it, or describing some other public figure's opinion.
And in any case, the fact that the NYT previously refused to talk about sex doesn't mean it wasn't an issue of interest to the public! Maybe it would be fair to say that the NYT used to be biased against discussing sex, but now is less so? But then isn't that interpretation just as available for racism or any other term showing an up-trend?
Rodger C said,
August 5, 2020 @ 8:31 am
I didn't mean to be unkind to Sister, I was just being snarky at the wall. My take on it is that masculine and neuter pronouns in IE languages agree in the genitive, so there, and if Sister wasn't German (my default picture of a nun, because Ohio Basin), she might have thought of "cujus." So there.
Yes, yes, "its." But when Milton's Satan said "the mind is it's [sic] own place," he was adopting a recent colloquialism (recent in 1667, not at the beginning of the universe) for extreme emphasis.
Viseguy said,
August 5, 2020 @ 7:40 pm
@Philip Taylor, who said: "… you might well have written 'I was […] unable to ever split an infinitive until a few years ago' …"
I was casting about for a split infinitive to demonstrate my un-constitutionality (so prevalent these days), but "ever … until a few years ago" didn't work for me, logically. I know that "forever" is a long time and, ergo, "ever" might be a shorter time … but no could do. "Forever", after all, means "for ever".
I'm sure there's a word for "a grammatical mistake made intentionally to illustrate (or debunk) a grammatical mistake", but I can't for the life of me think what it is. It's killing me, so please help!
~flow said,
August 6, 2020 @ 3:46 am
@chris "quite a few of the terms selected by Sabeti spike very recently, i.e., the NYT almost never discussed them until the last several years"—strictly speaking we can not even tell this much from the graphs as presented because they are adjusted (scaled and shifted) on both the low and the high end, IOW a term that hat a constant appearance throughout the decades of, say, 10 mentions per month but then goes up to 50 mentions in the last ten years is indistinguishable from one that never was mentioned at all but picked up recently. Whatever the minimum value is, we cannot tell, and we can not compare the minima and maxima between terms.
Philip Taylor said,
August 6, 2020 @ 7:13 am
Viseguy, I can't help with the word you seek, but the
Google 'ngram' viewer shews a steady (near-linear) growth in usage of the phrase "unable to ever" from 1966 to the present day. Prior to 1966 it was virtually unattested.Philip Taylor said,
August 6, 2020 @ 7:16 am
Apologies, that should have read :
Cat-induced error once again !
Viseguy said,
August 6, 2020 @ 5:22 pm
@Philip Taylor: I may well have only imagined that there was such a word. If not, I'm happy to make one up: grammatopoeia
PS: Enjoyed the Donald Knuth interview.
Philip Taylor said,
August 7, 2020 @ 2:55 pm
Sadly the OED does not admit of the existence of grammatopoeia, but if we both keep using it they may admit it one day !
Glad that you liked the DEK stuff.
Viseguy said,
August 7, 2020 @ 5:21 pm
@PT: "Sadly the OED does not admit of the existence of grammatopoeia …."
Well, it shows up on Google now. That's a start. And I just clicked "Add to dictionary" to disappear the annoying red squiggly line under it. Yet another claim to legitimacy!
The most prominent (to my mind) examples of grammatopoeia have to do with prepositions. There's the old chestnut, "A preposition is a word you should never end a sentence with", and the quip attributed to Churchill (an attribution that Ben Zimmer debunked in this space some 14 years ago): "This is the type of errant pedantry up with which I will not put."
@myl: Mea culpa (again) for (a) straying off-topic and (b) misspelling your surname in my comment above — although the latter was intentional, a point which (not that[!]) I trust Sister, in this context, would accept in mitigation of my culpability.