Cumulative syllable-scale power spectra
« previous post | next post »
Babies start making speech-like vocalizations long before they start to produce recognizable words — various stages of these sounds are variously described as cries, grunts, coos, goos, yells, growls, squeals, and "reduplicated" or "variegated" babbling. Developmental progress is marked by variable mixtures of variable versions of these noises, and their analysis may provide early evidence of later problems. But acoustic-phonetic analysis of infant vocalizations is hindered by the fact that many sounds (and sound-sequences) straddle category boundaries. And even for clear instances of "canonical babbling", annotators often disagree on syllable counts, making rate estimation difficult.
In "Towards automated babble metrics" (5/26/2019), I toyed with the idea that an antique work on instrumental phonetics — Potter, Koop and Green's 1947 book Visible Speech — might have suggested a partial solution:
By recording speech in such a way that its energy envelope only is reproduced, it is possible to learn something about the effects of recurrences such as occur in the recital of rimes or poetry. In one form of portrayal, the rectified speech envelope wave is speeded up one hundred times and translated to sound pattern form as if it were an audible note.
Since then, a bit of looking around in the literature turned up some interesting recent explorations of a similar idea: Sam Tilsen and Keith Johnson, "Low-frequency Fourier analysis of speech rhythm", JASA 2008; Sam Tilsen and Amalia Arvaniti, "Speech rhythm analysis with decomposition of the amplitude envelope: characterizing rhythmic patterns within and across languages", JASA 2013.
What I've done is quite different from the (analog) method discussed in Visible Speech, and also somewhat different from the various (digital) methods discussed in the Tilsen et al. works, though I suspect that the differences are not really critical, at least for the applications that I have in mind. For those who care about the details, I calculated the RMS amplitude of the speech signal, using a 25-millisecond window advanced 5 milliseconds at a time (so sampled at 200 Hz); I then smoothed the result by convolving with the derivative of a gaussian with a standard deviation of 70 milliseconds; and finally I calculated the power spectrum in a 2-second (or 3-second) hamming window, advanced 1 second at a time, and averaged those spectra over the whole of a selected recording. (Source code available on request.)
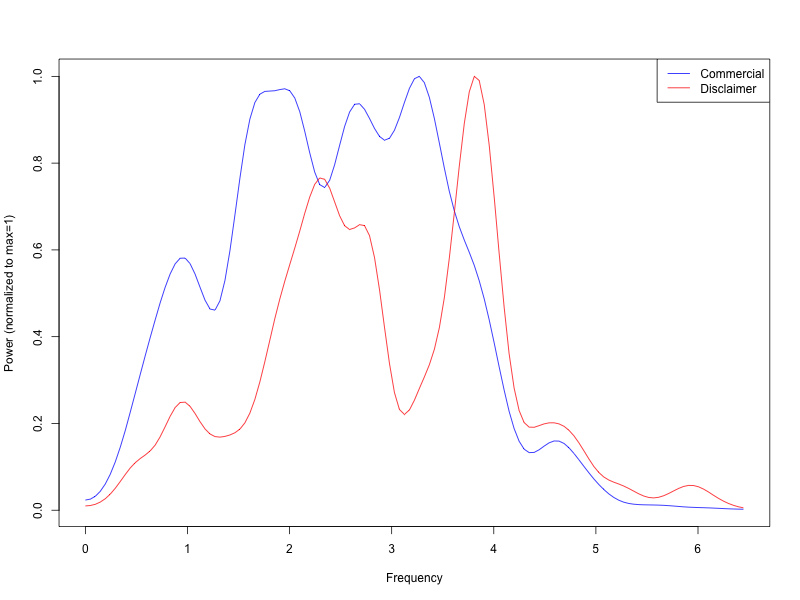
Here's the result, using a three-second analysis window, for the first 15 seconds of a car commercial:
and for this typically-rapid disclaimer:
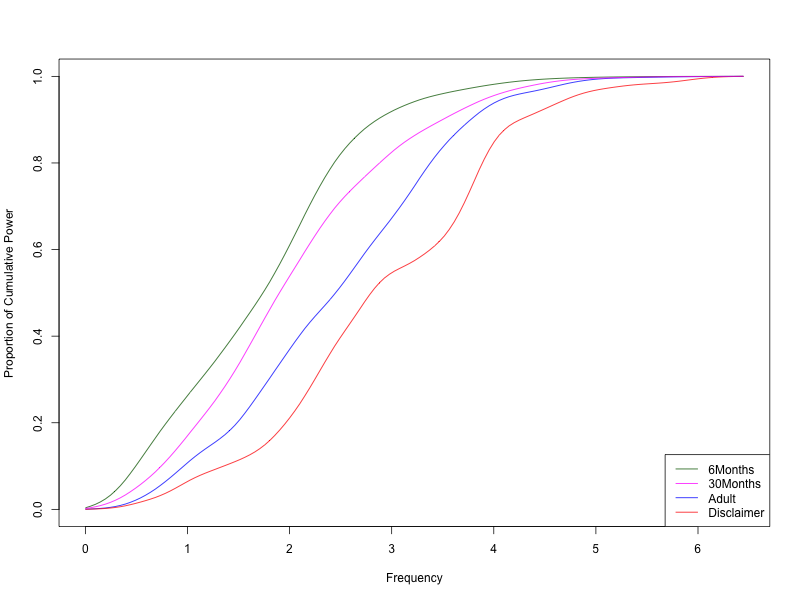
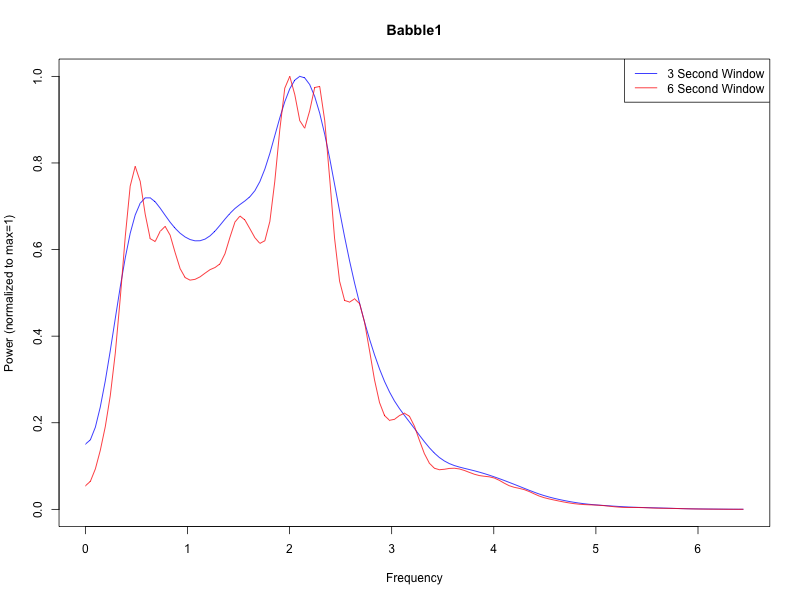
That looks sensible — but how can we reduce those sensible-looking wiggles to something more statistically tractable? One obvious idea is to look at the cumulative version. And let's add two other sources — this babble sample:
and this recording of a (highly verbal) 2-year-old:
The cumulative spectral power for all four:
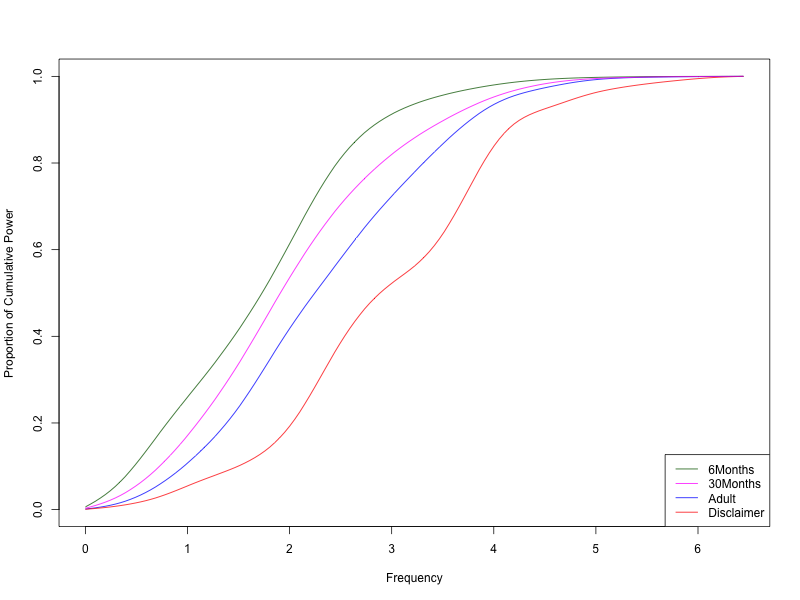
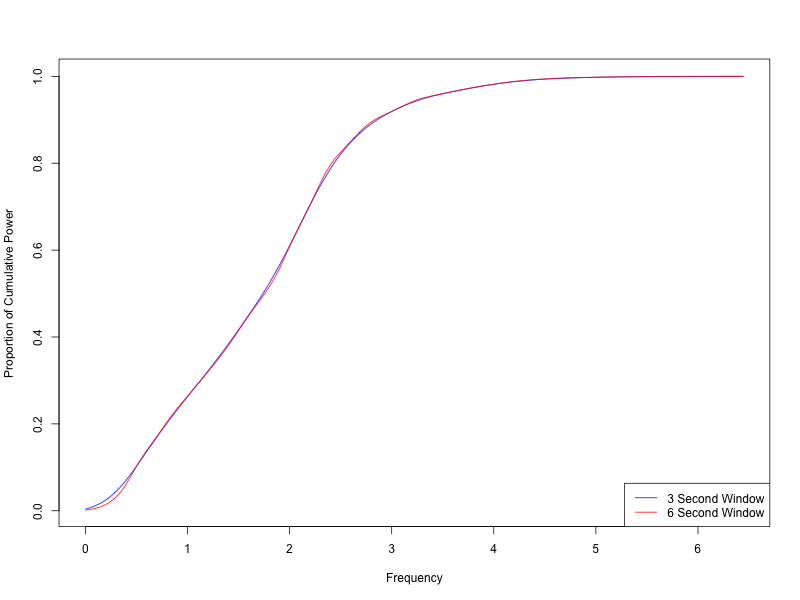
Here's the same thing using a two-second (rather than three-second) analysis window:
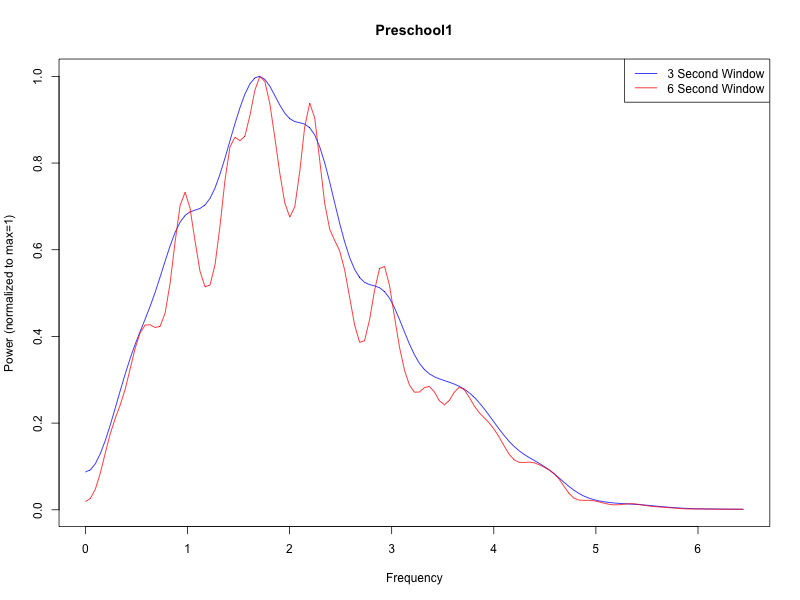
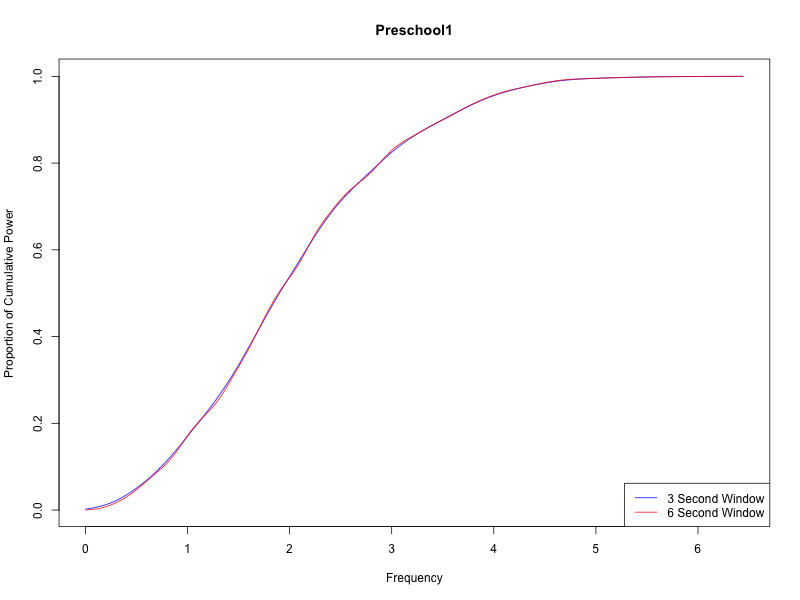
As you'd expect, the choice of spectral analysis window makes a difference in the power spectrum, but much less of a difference in the cumulative version:
And the same thing for the 2-year-old:
Four swallows don't make a summer. But this strikes me as (the start of) a promising way to quantify syllable-scale speaking rate in recordings where the notion of "syllable" may not be well defined.
Philip Taylor said,
June 11, 2019 @ 8:52 am
What was the reason for selecting "a gaussian with a standard deviation of 70 milliseconds", Mark ?
[(myl) Why a gaussian? Seems like a plausible generic smoother. Why the derivative? A crude "edge detector", to emphasize changes over levels. Why sd=70 msec? That's a rough fit to the integration time of human perception of amplitude and duration changes, as I recall. And empirically, it seems to produce a smoothed signal whose extrema correspond approximately to the edges of the things I hear as separate entities. I'm sure there are better choices, and there are surely more sophisticated processing methods. But this seems like a reasonable place to start.]
Philip Taylor said,
June 11, 2019 @ 4:20 pm
OK, thank you, it was really only the reason for the choice of 70ms that I was querying — I was confident that there were good clear reasons for the other two, but the reason for the third eluded me.
milu said,
June 13, 2019 @ 7:20 pm
i swear, i'm really interested, but i don't have the maths background to make sense of it in detail, so– just one question in the hope that it will illuminate me somewhat: in the graphs, the x-axis is the frequency of what exactly?
unekdoud said,
June 14, 2019 @ 7:42 pm
The simplest answer would be that it's the frequency of vocalizations: if a baby makes the sound "a da da da" then this method should estimate the number of da's per second, counted in 2 or 3-second windows.
This description is inadequate for the speech samples, where the syllable rate doesn't even fit in the graph, but I'd imagine the technique works just fine for figuring out who speaks faster (or abnormally).