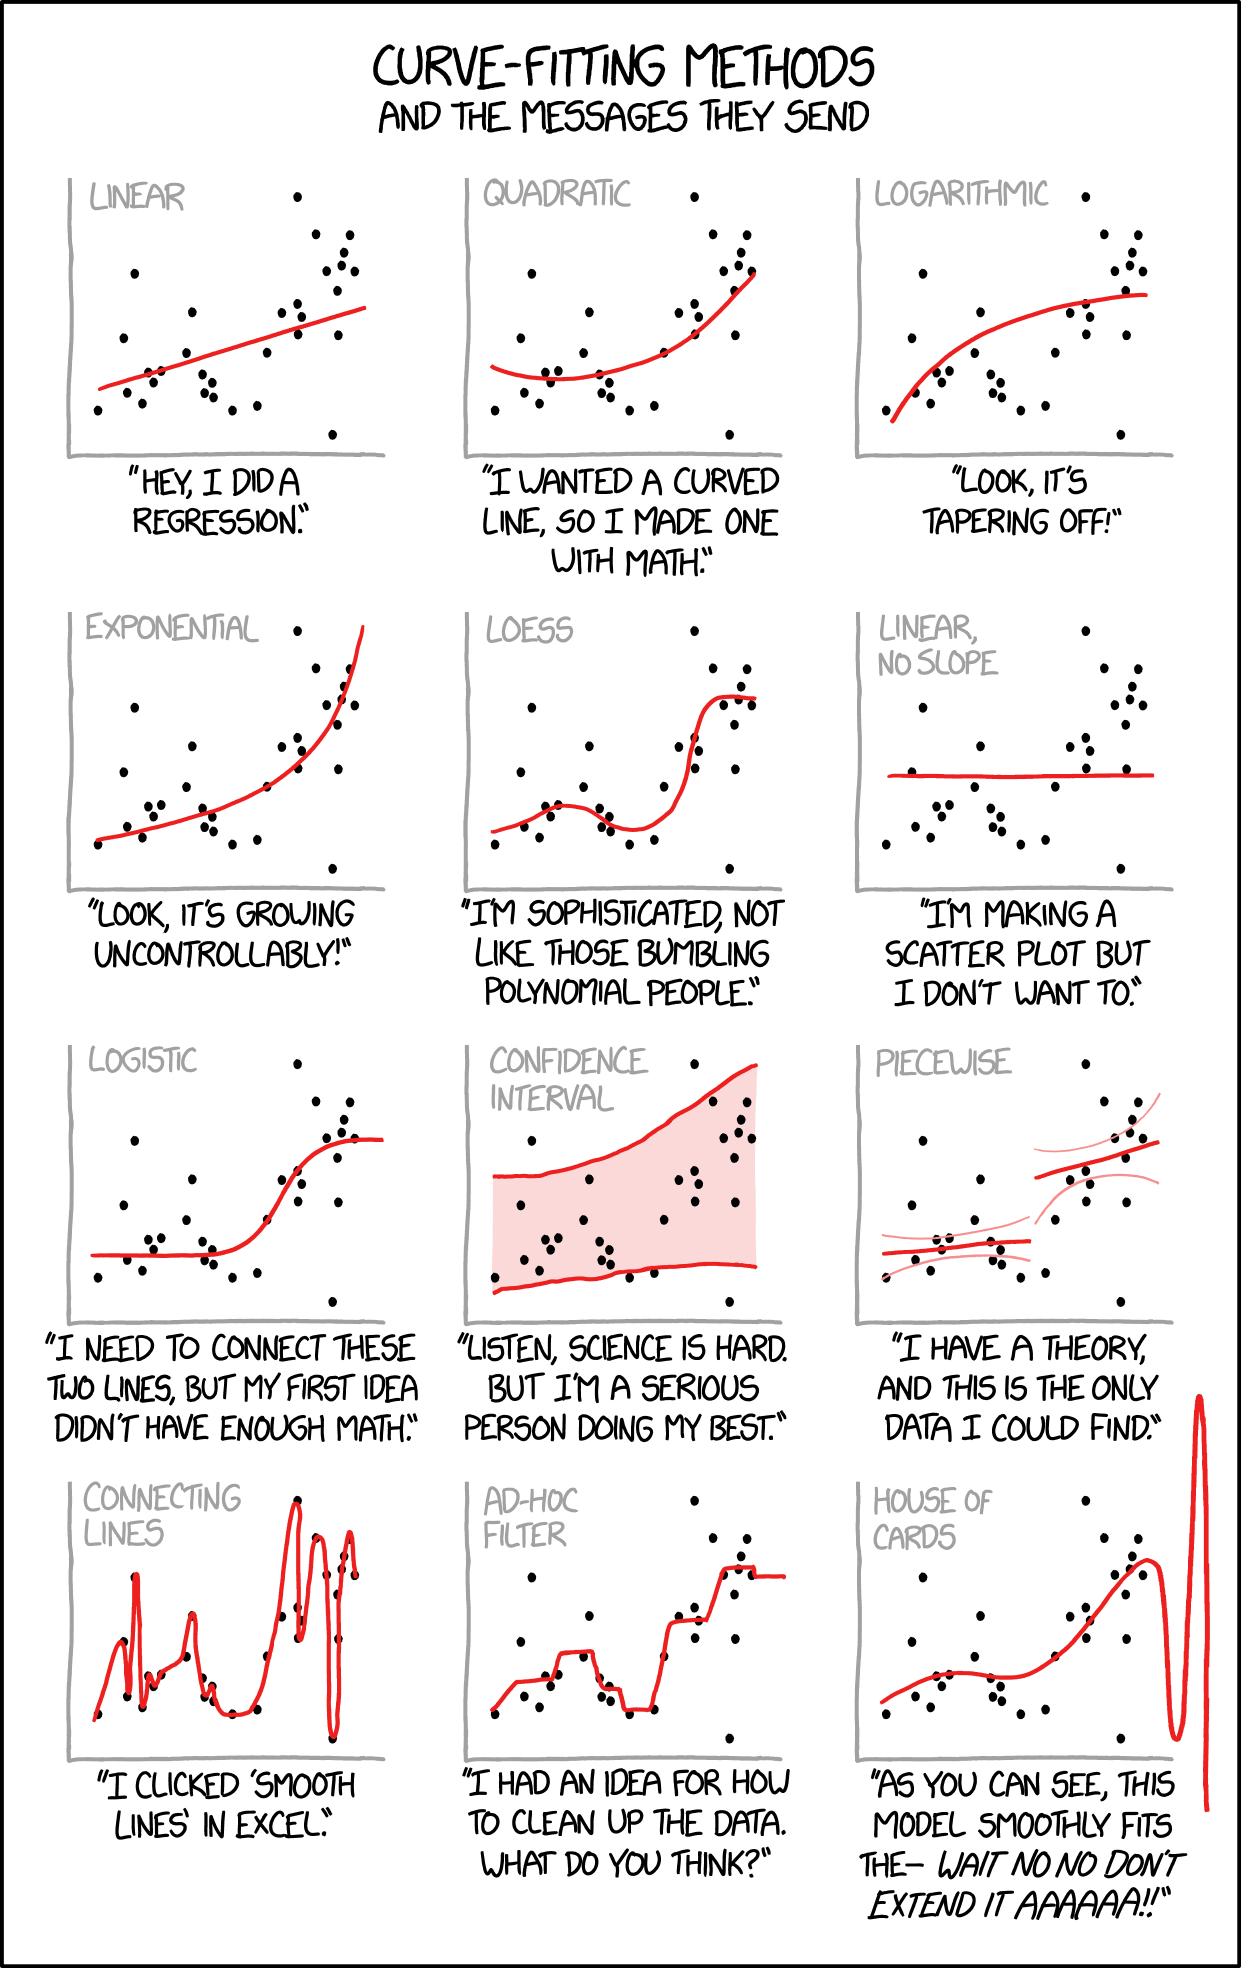
All too true
« previous post | next post »
Today's xkcd:
Mouseover title: "Cauchy-Lorentz: "Something alarmingly mathematical is happening, and you should probably pause to Google my name and check what field I originally worked in.""
September 20, 2018 @ 7:18 am · Filed by Mark Liberman under Linguistics in the comics
Powered By WordPress

unekdoud said,
September 20, 2018 @ 7:50 am
Very advanced ad-hoc filter: "We trained a 3-layer recurrent neural network on the data…"
KeithB said,
September 20, 2018 @ 9:12 am
How about a "log sine" curve:
http://www.talkorigins.org/faqs/c-decay.html
bks said,
September 20, 2018 @ 10:40 am
The Banana Plot:
https://78.media.tumblr.com/tumblr_m723nmp5OM1qbh26io1_1280.jpg
Bob Ladd said,
September 20, 2018 @ 3:02 pm
Or, in the same vein as the log sine curve or the banana plot, the lizard plot in Pierrehumbert & Liberman's 1982 review of Cooper & Sorensen's book on intonation. This appears to be firmly hidden behind multiple paywalls, but perhaps MYL could be persuaded to post a link to an accessible version.
[(myl) The reference is "Modeling the Fundamental Frequency of the Voice", Contemporary Psychology: APA Review of Books, 1982, Vol 27(9), 690-692, which was a review of Cooper and Sorensen, Fundamental Frequency in Sentence Production, Springer-Verlag, 1981. The relevant segment of the text:
The proposal that Cooper and Sorensen view as the most significant outcome of their investigation (p. 160) is the top-line rule, which describes declination by using the first and final peak values to predict those in between. Three deficiencies in the development of this proposal make it a poor centerpiece for the book. First, the authors put forward this proposal, like others in the book, without serious discussion of alternatives. One of the main reasons to study declination is that it may reflect advance planning of speech production. However, one work cited (Fujisaki & Sudo, 1970) generates declination without such planning by using exponential functions. Although the output of the topline rule resembles an exponential, Cooper and Sorensen presuppose advance planning without argument. All models considered are close relatives of the model adopted and use the final peak value in predicting earlier ones. A second reason to study declination, as the authors observe, is so that it may be factored out in future studies of other influences on FO. For example, they note that unequal stress can cause medial peaks to fall above or below the predicted declination line. It is by comparing the peak heights to the predicted declination that one might hope to model such effects quantitatively. This concern, which is a central one, cannot be addressed by a rule that uses particular peaks to predict others, as the topline rule does. The peaks used as anchor points are themselves variable due to stress. So, the topline rule confounds stress effects on the anchor points with declination. To separate these influences, it is necessary to posit an implicit declination function and then solve for stress and declination effects simultaneously. This is the approach taken in Fujisaki and Sudo (1970) and Liberman and Pierrehumbert (1979).
The third and most serious problem with the topline rule arises because of the statistic used in fitting the model to the data. The error metric used is the mean signed deviation. The authors use this metric rather than the mean squared or mean absolute deviation because they believe it permits them to capture the trend of the data while eliminating extraneous effects due to factors like vowel quality and stress. This belief is completely misguided. Any nonvertical line through the mean of a set of points yields a mean signed deviation of zero. As our figure shows, such a line need not bear any relation to the trend of the data. Similar results obtain for curves of other shapes that are fit under appropriate transforms. Thus, the small nonzero error of Cooper and Sorensen's model cannot be taken to mean that the model captures the main features of the data. Comparisons between small nonzero errors for alternative formulations, like those on pages 45 and 48, are meaningless.
The figure:
Caption: "All of the lines shown fit the data points with a mean signed deviation of O. Mean absolute deviations range from 5.1 to 42."
]
Bob Ladd said,
September 21, 2018 @ 1:19 am
Thanks, Mark!
ajay said,
September 21, 2018 @ 9:16 am
The xkcd and the lizard plot are both excellent.