Political sound and silence II
« previous post | next post »
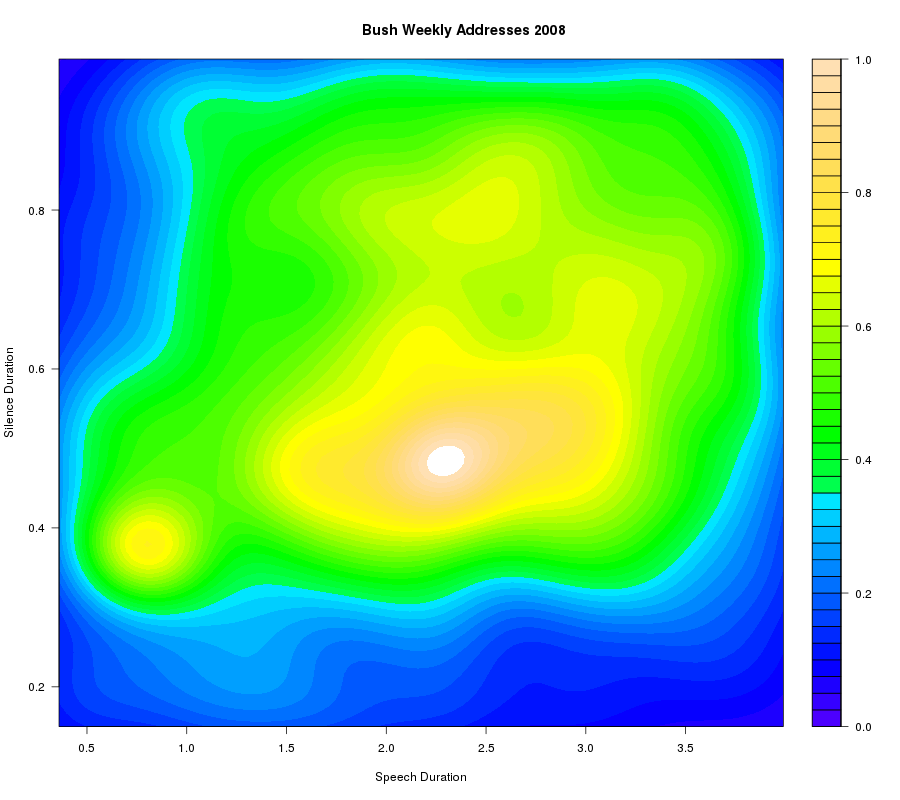
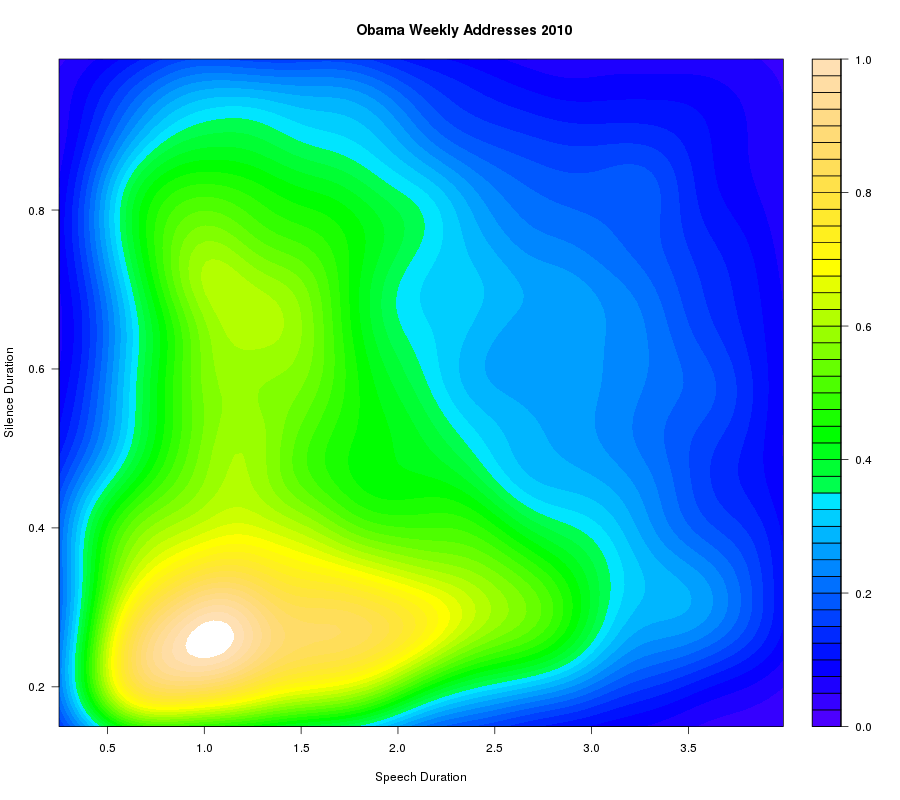
In "Political Sound and Silence", 2/8/2016, I compared the joint distribution of speech segment durations and (immediately following) silence segment durations in the Weekly Addresses of Presidents George W. Bush and Barack Obama:
 |
 |
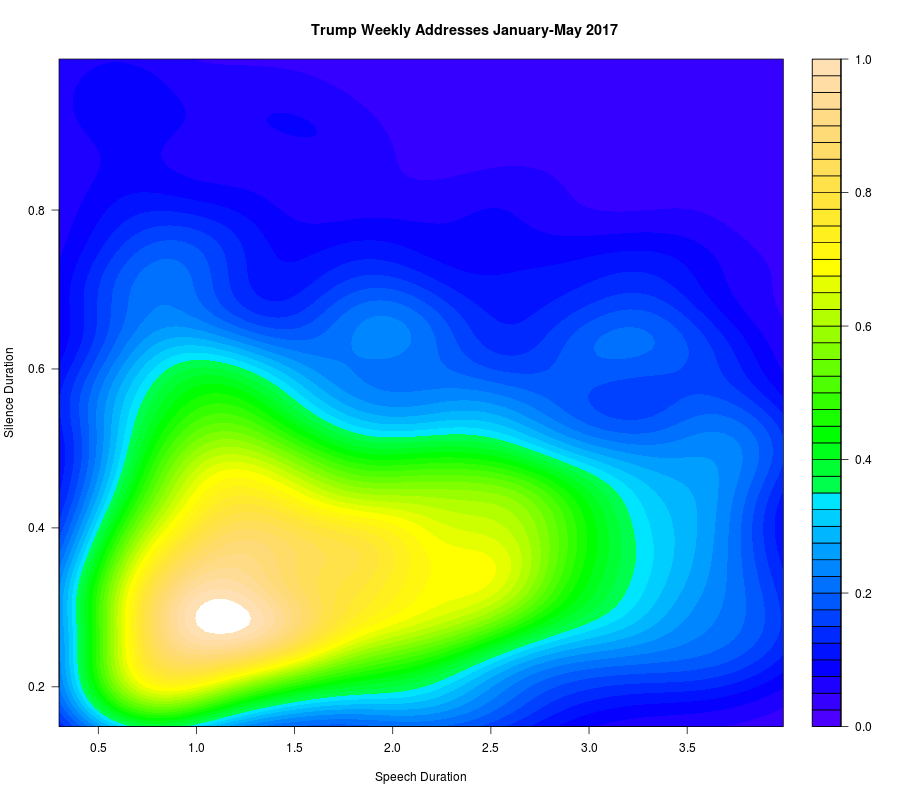
Today I thought I'd add a similar graph for President Donald Trump's Weekly Addresses so far in 2017:
And a table of some other relevant values, including estimates of overall speaking rate and speaking rate excluding silent pauses:
| N | Speech (sec.) |
Silence (sec.) |
Total (sec.) |
Mean Duration |
% Speech | Words | WPM (overall) |
WPM (excl. silence) |
|
| Bush 2008 | 48 | 8262 | 1976 | 10237 | 213 | 0.807 | 24483 | 166.9 | 206.9 |
| Obama 2010 | 50 | 9840 | 2884 | 12724 | 254 | 0.773 | 38253 | 180.4 | 233.3 |
| Trump 2017 | 14 | 2417 | 480 | 2898 | 207 | 0.834 | 7131 | 147.6 | 177.0 |
I believe that all of the addresses in the comparisons above were read from a prepared text, and were delivered from a seated posture in a quiet room (I think usually the Oval Office).

unekdoud said,
May 31, 2017 @ 12:59 am
Are there any trends over the weekly addresses for these measures? In particular, is speech duration or speech % correlated with median pitch?
[(myl) Good questions, which will take an hour or so to answer. Today is full — maybe tomorrow.]