Rexthor
« previous post | next post »
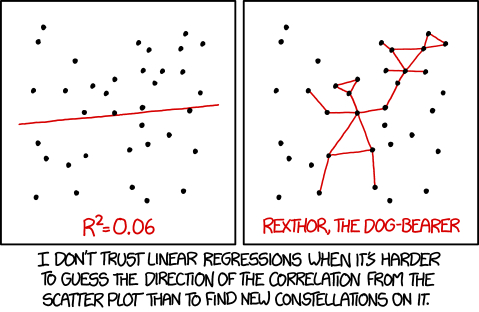
Today's xkcd:

Mouseover Title: "The 95% confidence interval suggests Rexthor's dog could also be a cat, or possibly a teapot."
But what if the publication doesn't give you the coordinates of the stars?
Note that R2=0.06 is the sort of thing that all-too-often gets featured in scientific publications and then trumpeted in the mass-media uptake — if you don't believe me, see "Statistical cognition in the media", 8/4/2015, where a dataset involving relations of R2=0.02 and below was characterized as "a clear link between people's cognitive styles and the type and depth of emotion they prefer in music". Other coverage described the findings using generic plurals to express apparently essential properties of the groups in question:
"Greenberg found that people who scored high on empathy tended to prefer music that was mellow (like soft rock and R&B), unpretentious (country and folk), and contemporary (Euro pop and electronica.) What they didn’t like, meanwhile, was 'intense' music, which he classified as things like punk and heavy metal. People who scored high on systemizing, meanwhile, had just the opposite preferences—they kick back to Slayer and could do without Courtney Barnett."
Stuff like that almost justifies the public's willingness to put political affinity over what "science" supposedly says.
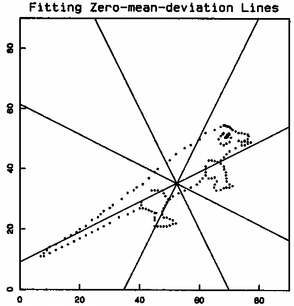
As for finding pictures in scatterplots, I once criticized the use of "mean signed deviation" as a way of evaluating the fit of a model by using this picture

with the caption
Figure 1. All of the lines shown fit the data points with a mean signed deviation of 0. Mean absolute deviations range from 5.1 to 42.
In fairness, the iguana was invented — real data is never that clear. And the picture shouldn't have been necessary, but …
bks said,
August 27, 2016 @ 7:57 am
xkcd needs a graduate student to purge the obviously bad data (but not, heaven forfend, the outliers) from the plot.
[(myl) There's certainly plenty of "bad-data" removal, as well as non-blind subjective data coding. But the most important method is just to publish a table of regression coefficients or F-test values or whatever, or maybe a plot of the lines generated by a model of some sort.]
D.O. said,
August 27, 2016 @ 9:27 am
Funnily, people actually do it with constellations. Well, maybe not exactly (I would not be surprised if with them too, though). But with microwave background radiation. It is highly isotropic, but there are small variations. Which, some claim, tell us something about early universe.
Brett said,
August 27, 2016 @ 9:29 am
I'm just flabbergasted that somebody thought that mean signed variation was a useful quantity.
[(myl) It was in a book published by Springer, whose first author was then a professor at Harvard and went on to become a university president.]
Jake said,
August 27, 2016 @ 9:51 am
Shouldn't that constellation be something more like "Cynophor"?
DG said,
August 27, 2016 @ 10:11 am
I think it would be even funnier if instead we named constellations based on their statistical properties when interpreted as a 2D scatter plot.
Rodger C said,
August 27, 2016 @ 10:31 am
@myl: Why am I not surprised that the author of this became an administrator? It's not the first case I've seen of same after boggling at an old article.
Andrew (not the same one) said,
August 27, 2016 @ 12:11 pm
Jake: I take it that 'Rexthor' is meant to be the actual name of a dog-carrying character from mythology (just as we say 'Orion', not 'Cynegetes').
Gregory Kusnick said,
August 27, 2016 @ 3:55 pm
D.O.: Here is a plot of the power spectrum of the CMB anisotropy, with the actual data points plotted along with the predictions of various theoretical models of the early universe. I don't think we need to resort to pareidolia or wishful thinking to decide which model is likely to be correct.
The Other Mark P said,
August 27, 2016 @ 6:29 pm
Andrew – it parses as Rex Thor
Douglas Bagnall said,
August 27, 2016 @ 8:43 pm
I like the joke and its sentiment, but wouldn't the constellation be easier to find if the data all lined up nicely? Something like "Raxthor's remarkably straight staff" or "Zophoose, the gently exponential snake given substance by an overlay of Gaussian noise".
KWillets said,
August 27, 2016 @ 11:29 pm
Have you tried playing Guess the Correlation?
After a few rounds I have a mental picture of what 0.06 looks like. Maybe if the media did this they would learn what unplausibility looks like.
James Wimberley said,
August 28, 2016 @ 5:55 am
Can't the Greenberg study be read negatively? "Empathy has practically nothing to do with musical tastes." That would be a real finding, confirming Höss' Auschwitz orchestra.
Pflaumbaum said,
August 28, 2016 @ 9:08 am
@ Gregory Kusnick-
Yeah, to my shame I dont understand the statistics in this discussion, so have to rely on authority. But having talked to both Alan Guth and Andrei Linde about inflation and the CMB data, I'm guessing that those guys do understand these issues, probably considerably better than D.O.
Steve Morrison said,
August 28, 2016 @ 11:47 am
In his autobiography, the mathematician Stanislaw Ulam relates a story where he and John von Neumann watched some scientist presenting a paper. There was a scatterplot graph where the presenter insisted that the points lay on a line. Von Neumann whispered, “At least, they all lie on a plane!”
Viseguy said,
August 28, 2016 @ 6:33 pm
@Steve Morrison: Priceless.
Chris C. said,
August 29, 2016 @ 10:36 pm
When I first saw this, it struck me that Rexthor's "dog" better resembles a tropical cocktail with a decorative umbrella and a swizzle stick. This constellation should clearly be re-interpreted as Melissa the Cocktail Waitress.