Biomedical nerdview
« previous post | next post »
My new hobby, as Randall Munroe sometimes says, is asking biomedical researchers what "sensitivity" and "specificity" mean. The modal response is "Um, yes, I always have to look those up".
But recently, preparing a homework assignment about the evaluation of binary classifiers, I had a flash of insight. My new insight answers one of the questions I've always had about these terms: Why do biomedical researchers focus on the (apparently misleading) concepts that "sensitivity" and "specificity" denote? (My other question remains unanswered: Why did they pick those singularly un-mnemonic names? As far as I can see, they might as well have called them "delicacy" and "capacity", or "intensity" and "curiosity", or "Jupiter" and "Saturn".)
This all starts with a situation where we want to know whether each of a large set of instances is — or is not — a member of some class. The answer should be more-or-less a matter of objective fact, although determining the fact of the matter may be expensive or may require waiting for an outcome.
The issue might be a question of medical diagnosis, like "this blood sample comes from someone with breast cancer", which could be used for screening affected populations on a large scale, or for confirming a diagnosis suggested for other reasons.
Or the problem might be a matter of image analysis, like "these two pictures of faces are pictures of the same person", which could be used to index images for search, to tag friends in Facebook posts, or to monitor airports for wanted criminals. It might be a text-analysis question, like "this string of words expresses a negative opinion about a particular person, company, or product"), which could be used to estimate popular sentiment from Twitter traffic. Or it might be a deception-detection question: "Is this witness telling the truth?" A large range of real-world problems can be re-formulated as one or more yes/no questions of this type.
And we also have a potentially promising method for solving our problem — promising because it's cheap, or because it's fast, or because it offers a valuable prediction about things that otherwise won't be revealed until some time in the future. The method might be a chemical test, or a computer algorithm, or a piece of apparatus, or a self-proclaimed psychic, or any other way of mapping instances to answers.
Whatever the problem and whatever the proposed method, we want to determine how well the method works. What performance metric should we use?
We start by testing a large-enough sample, and arranging the results in a simple 2×2 table like this:
| Reality is Positive (P) | Reality is Negative (N) | |
| Test is Positive | True Positive (TP) | False Positive (FP) |
| Test is Negative | False Negative (FN) | True Negative (TN) |
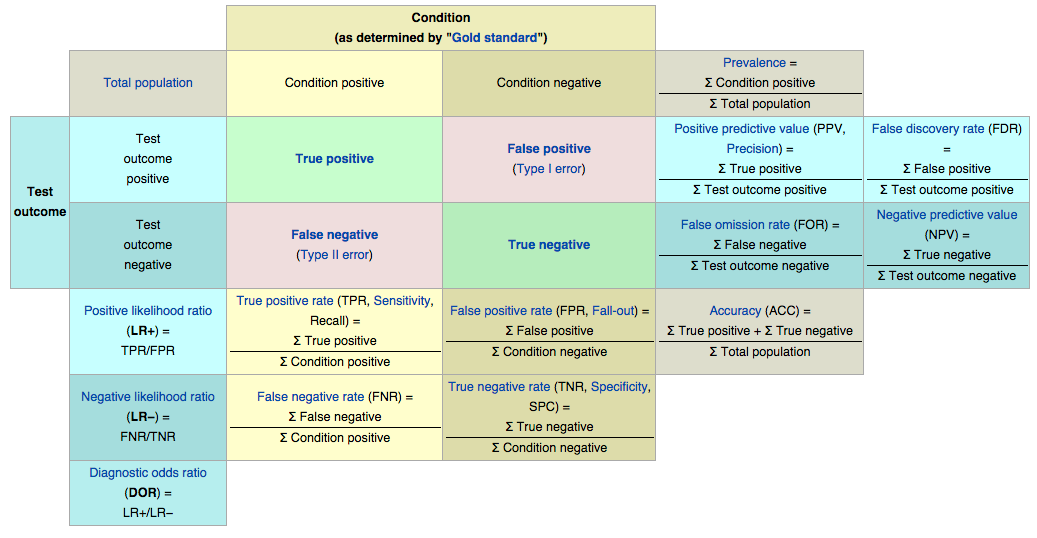
In the case of medical tests for diseases or conditions, we then traditionally define those oddly-named metrics sensitivity and specificity. Sensitivity is the "true positive rate", the proportion of individuals with the condition who test positive — TP/(TP+FN). And specificity is the "true negative rate", the proportion of individuals without the condition who test negative – TN/(TN+FP).
This simple table allows us to define a whole bestiary of additional concepts and terms, as indicated by the encrustations in this helpful graphic from the Wikipedia article on Sensitivity and Specificity.
The trouble with the standard biomedical pair sensitivity and specificity, aside from their semi-meaningless lexical semantics, is that they're profoundly misleading with respect to (what I always thought was) the natural context for interpreting biomedical test accuracy.
If I undergo a screening test and come up positive for some serious condition X, what I want to know is how likely it is that I actually have X. So my doctor tells me that the test has sensitivity and specificity of 90%, or more likely just that it's "90% accurate", and I thereby come to believe that the odds are 9 out of 10 that I've got X.
But in fact the odds are almost certainly much lower than that.
Suppose that condition X has an incidence of 600 per 100,000 in people my age (which is roughly the incidence of prostate cancer in men my age, according to this chart).
Then in 100,000 men, 600 have the condition. Since the sensitivity is 90%, 0.9*600=540 of these will test positive. There are 100000-600=99400 men who don't have the condition, and since the specificity is 90%, 10% of these will also test positive: 0.1*99400=9940 false positives.
Adding it up, we expect 9940+540=10480 men my age to test positive, and of these, we expect that 540 actually have condition X. So my odds of having condition X are 540 in 10480, or about 1 chance in 19 — not nine chances in 10!
(And in fact, Flip H. Jansen et al, "Prostate-Specific Antigen (PSA) Isoform p2PSA in Combination with Total PSA and Free PSA Improves Diagnostic Accuracy in Prostate Cancer Detection" tells me that the traditional %fPSA test has 22.2% specificity at 90% sensitivity, while the latest fancy multitvariate combination of indicators has 36.2% specificity at 90% sensitivity. So the expected number of false positives is 0.878*99400=87273, and the chances that someone who tests positive actually has the condition are 540 in 87273+540, or 540 in 87813, or about one in 163. But that's part of another discussion.)
So what's my flash of insight? Well, the focus on "percent correct" in the columns of the 2×2 contingency table reflects the perspective of someone in the field of public health or epidemiology, not the perspective of a patient (or even a physician dealing with patients). It tells us how well we're doing at identifying the sick and not-sick portions of the population.
But as a patient, I don't give (much of) a damn about the public health issues. What I want to know is the odds that I personally have the condition. And to calculate that, we need to look at the rows of the table, not the columns.
If my test is positive, I want to know the "positive predictive value" — what proportion of the people with positive test results actually have the condition. If my test is negative, I want to know the "negative predictive value" — what proportion of the people with negative test results are actually free of the condition.
To insist on giving everyone the "sensitivity" and "specificity" values — especially disguised under names that tell us essentially nothing about what these values mean — is a form of what Geoff Pullum has called nerdview:
The problem I am pointing to […] is a simple problem that afflicts us all: people with any kind of technical knowledge of a domain tend to get hopelessly (and unwittingly) stuck in a frame of reference that relates to their view of the issue, and their trade's technical parlance, not that of the ordinary humans with whom they so signally fail to engage.
"Sensitivity" and "specificity", under whatever names, are concepts from a frame of reference defined by the interests of public health researchers. These concepts should be banned from any discourse aimed at patients or people who deal with patients. But they aren't.
Tom Parmenter said,
September 26, 2014 @ 3:27 pm
Problem possibly related to the wording of ballot questions, that is "Vote NO if in FAVOR".
tpr said,
September 26, 2014 @ 3:27 pm
An essay from Steven Pinker published yesterday mostly about 'nerdview' (though he doesn't use that term):
The Source of Bad Writing: The 'curse of knowledge' leads writers to assume their readers know everything they know
GH said,
September 26, 2014 @ 4:00 pm
Isn't the problem that "positive predictive value" and "negative predictive value" are highly dependent on the background rate of incidence (or in Bayesian terms, our prior belief), which can vary depending on a number of factors outside the test?
For example, in the prostate cancer case, do you just take the overall risk of prostate cancer for all men, or do you consider the patient's age group, family health history, or even potentially the results of gene screenings?
[(myl) Of course knowing the "base rate" is crucial to avoiding the "base rate fallacy". But if you want to know how well the test will perform in a real-world situation, or what a particular result really means, there's no choice. That's why I went at least to a source of data about prostate cancer rate as a function of age. And while it's true that if we knew more (about my genetics and life history and so on) we could make a better prediction, we're not going to overcome the difference between 9 out of ten and 1 out of 19 (or the much lower odds that would emerge if we used the real specificity of 20% or so).]
Michael Bench-Capon said,
September 26, 2014 @ 4:10 pm
Mark,
I agree with you that giving patients the specificity and sensitivity is nerdview and less helpful than telling them what the likelihood is, given a positive result, that they have the disease. But I don't think they're such silly terms.
Sensitivity is how sensitive the test for, say, breast cancer is to breast cancer. As in, how often does it pick it up? Specificity is how specific the positive result is to breast cancer. As in, does that result come up for a lot of other things too?
I don't know whether this is where the terms come from, but even if it isn't, I think this is a reasonable mnemonic. If you agree, then when those biomedical researchers give their modal response, you can explain it to them that way.
Thomas Rees said,
September 26, 2014 @ 4:59 pm
Randall Munroe. Thanks, autocorrect.
Daniel Johnson said,
September 26, 2014 @ 5:03 pm
In aircraft cockpit warnings, the key performance metrics are "Probability of Detection" for the sensitivity, and "False Alarm Rate" for negative predictive value. Typical requirements are 90% probability of detection with only 5% false alarm rates, because the last thing you want is for pilots to get used to ignoring warnings because of a lot of false alarms. Needless to say, a 18/19 = 94.74% false alarm rate is never going to fly.
Gregory Kusnick said,
September 26, 2014 @ 6:04 pm
It seems to me there can be circumstances in which sensitivity and/or specificity might be of legitimate interest to the patient.
Suppose, for instance, that cancer is already suspected for other reasons. My doctor gives me a choice of confirmatory tests: an invasive endoscopy, or an MRI. In that situation I would want to know how reliable the different tests are at detecting the cancer (on the assumption that it exists) before making a decision.
Julian Hook said,
September 26, 2014 @ 6:05 pm
The phenomenon described here is only one example of how the typical language in which medical studies are couched fails to work to the patient's benefit.
Another example is the tendency to describe the effectiveness of medications or medical procedures in terms of relative risk reduction: for instance, "If you take wonder-drug W, your risk of getting nasty condition X will decrease by Z percent!" This utterly fails to account for the many people who may take drug W but who may never have been susceptible to condition X in the first place.
Suppose a statin manufacturer says their drug reduces the risk of a heart attack by 33%. That could (and probably does) mean that during the trial period, 2% of the people taking the drug had a heart attack, compared with 3% of the people in the control group. That's a 33% relative risk reduction, but only a 1% absolute risk reduction: only one out of every 100 people taking the drug is saved from a heart attack by doing so.
If they tell you that taking the drug will reduce your risk of a heart attack by 33% while there is only a 5% risk of a serious side effect, that might sound like a good tradeoff. But if they tell you that there's a 1-in-100 chance that taking this drug will prevent you from having a heart attack, and a 5-in-100 chance that it will give you a serious side effect? Not so much.
GH said,
September 26, 2014 @ 7:12 pm
@myl:
Perhaps the base rate for prostate cancer doesn't vary enough to make a big difference, but there must be many conditions for which it does.
[(myl) Actually, the base rate for prostate cancer varies enormously by age, from nearly zero up to age 40 to about 800 per 100,000 at age 75.]
For example, going by the overall US infection rate (0.6%), a positive HIV test (which apparently has a sensitivity of about 99.7% and a specificity of 98.5% three months after potential infection) would mean you're still more likely than not to not be infected. 598 TP : 1491 FP => 28.6% likelihood of a true positive. However, for a man who has had sex with men (the most common form of transmission, and a group with an 18% infection rate), the numbers would look entirely different, and on that basis a positive test would mean a 93.6%* likelihood of actually being infected.[1]
Additionally, many medical tests – routine screenings aside – are presumably performed precisely because there is some reason to suspect the condition in question. So the proper base rate isn't incidence among the overall population, but among people who get tested, which could be orders of magnitude larger (but is also harder to find out, and more susceptible to bias).
And yes, obviously all of this is important and needs to be taken into consideration when interpreting the test. But it is also complex, hard to properly calculate, and the line between the predictive value of the test itself and the doctor's diagnosis based on all the known information gets fuzzy. I certainly don't think physicians should present the accuracy of a test in terms patients are likely to misinterpret, but I also understand why they wouldn't want to use numbers that rely on base rates.
[1] http://www.cdc.gov/hiv/pdf/surveillance_Report_vol_19_no_2.pdf
http://www.aids.gov/hiv-aids-basics/hiv-aids-101/statistics/
http://i-base.info/guides/testing/test-accuracy-results-and-further-testing
Ben Artin said,
September 26, 2014 @ 7:22 pm
One reason that this happens, as someone else alluded to, is that specificity and sensitivity are features of the test, whereas positive/negative predictive value are features of the test within a given population.
For example, if I am tested for flu and the test comes out positive, if I ask "what are the odds that I have the flu", there is no way to answer that question. The probability that a person has the flu (given the positive test) is not equal to the probability that a male has the flu (given the positive test) is not equal to the probability that a male in his 30s has the flu (given the positive test), etc etc etc.
All other outcome-based measures (such as NNT) suffer from the same problem.
But this doesn't mean that I disagree with your position. It just means that you can't simply replace specificity/sensitivity with PPV/NPV/NNT/etc and move on with your life. Right now we are giving patients a number that cannot be interpreted without education in subtleties of conditional probability, which is essentially useless. We could be giving them a number that cannot be provided without educating providers in subtleties of conditional probability, which is (sadly) harder than you (or I) might want it to be.
In the end, it comes down to this: it's impossible to meaningfully interpret the world around us without some understanding of conditional probability, but many highly trained (and highly regarded) people, such as most MDs, try it anyway.
[(myl) How about an interactive app that takes relevant demographic information along with the test result, and calculates the appropriate conditional probability given the most recent information? It could be hedged appropriately, and could explain its reasoning in a transparent way.]
Pflaumbaum said,
September 26, 2014 @ 11:14 pm
Gerd Gigerenzer spends much of his book 'Reckoning with Risk' on these issues of sensitivity, specificity, prevalence and PPV, with many real-world examples including the potentially disastrous statistical ignorance shown by many staff at AIDS testing centres.
Gigerenzer's main suggestion isn't about terminology, but that we should teach probability using population numbers – as MYL does above when he breaks it down to 100,000 men – instead of percentages as much as possible. The argument being that they're a much more natural way for most people to think.
Which is certainly the case for me anyway – I was trying to explain this point to a sceptical doctor friend a couple of years after reading the book, and having forgotten his strategy I got myself hopelessly confused using percentages.
Don said,
September 26, 2014 @ 11:47 pm
Most trivial nitpick ever, but the xkcd phrase is usually or always "my hobby," not "my new hobby."
Neal Goldfarb said,
September 27, 2014 @ 12:18 am
Speaking of semantically-opaque statistical terms…How about "Type 1 Error" and "Type 2 Error"? Those uniformative terms are especially frustrating given that there are perfectly clear alternatives: "false positive" and "false negative."
peterv said,
September 27, 2014 @ 1:55 am
Neal – these two sets of terms are not equivalent. Type I Error/Type II Error refers to the two errors of testing regardless of the orientation of the null and alternative hypotheses under test. False Positive/Negative only make sense if the null hypothesis is an hypothesis of no effect, and the alternative hypothesis is one of an effect. The two terms don't apply when the two hypotheses are reversed.
In other words, Type I/II Error are terms neutral with respect to the hypothesis statements being tested, something False Positive/Negative are not.
John Swindle said,
September 27, 2014 @ 2:00 am
It's like sensitivity and selectively in radio communications. You want the medical test or the radio to be sensitive enough to pick up the desired signal, if it's there, and specific or selective enough to reject everything else.
Howard Oakley said,
September 27, 2014 @ 5:15 am
Sensitivity and specificity have only relatively recently come into vogue – go back 30 years or so and the far more meaningful measures of false positive and negative rates were a greater concern.
There is a slight twist to this, in that your illustration concerns screening, in which it is assumed that your a priori risk is the same as that of the general population. Many medical tests are of course applied to those who are considered to be more likely to have the condition, which does shorten the odds significantly.
These also all assume that there is a Gold Standard, which has zero false positives and negatives. In many conditions and tests, there is no true Gold Standard, making the whole thing even murkier.
Howard.
peterv said,
September 27, 2014 @ 5:46 am
It is easy to design and execute a test with the feature of zero false positives or a test with zero false negatives – just assign every case to the same category (all negative, or all positive respectively). The challenge for test designers is that these two features are usually inversely related, at least roughly – the lower the rate of one, the higher the rate of the other, ceteris paribus. Which error you consider it is better to avoid should depend on the consequences of the two errors in the specific domain under study. The 1928 paper by Neyman and Pearson which first proposed the structure of hypothesis testing traded these errors off (by selected a significance test threshold) on the basis of an analysis of the consequences of these errors in pure agricultural science, for example, assessing the differential yields of two strains of wheat. There is no reason at all to suppose that a rational decision-maker would make the same tradeoff for (say) medical tests or in deciding whether to outlaw the use of a pesticide. In any other domain, the consequences of the two errors will likely be different to that of pure science, and, moreover, may accrue to different groups of people, at different places, at different times, and with different individual or social end-results.
For a discussion of this issue, see the paper by Talbot Page in "Ecology Law Quarterly" (1978), volume 7(2): 207-244.
Brian Ogilvie said,
September 27, 2014 @ 8:49 am
I was going to mention Gigerenzer's work, though Pflaumbaum beat me to it. He argues that expressing statistical regularities in terms of natural frequencies (3 in 10,000) makes it a lot easier for us to grasp them than expressing them in percentages (0.03%).
BTW, his book published as _Reckoning with Risk_ in the UK was titled _Calculated Risks_ in the US and Canada, because the North American publisher thought that "reckoning" was a regionalism that not everyone would recognize.
GH said,
September 27, 2014 @ 8:51 am
@ Ben Artin:
Thanks! You articulated what I was trying to say much more clearly.
I'd like to believe that better education and better explanations could solve the problem, but I suspect there's not much that can be done about the fact that most humans find conditional probability deeply unintuitive. And while negations may confuse us to amusing or annoying effect, the failure of our poor monkey brains to properly grasp conditional probability can often have deadly serious consequences.
Neal Goldfarb said,
September 27, 2014 @ 10:46 am
@peterv: "Neal – these two sets of terms are not equivalent."
I should have known better than to peeve on Language Log.
Neal Goldfarb said,
September 27, 2014 @ 10:46 am
@peterv: "Neal – these two sets of terms are not equivalent."
I should have known better than to peeve on Language Log.
Gregory Kusnick said,
September 27, 2014 @ 12:26 pm
Pflaumbaum and Brian Ogilvie: I'm not clear (and the Wikipedia article on Gigerenzer did not shed much light) on the distinction you're making between percentages and natural frequencies, since percentage is of course just frequency per 100 individuals. Is the claim that our poor monkey brains can't handle decimal points, so we need a bigger denominator (e.g. frequency per 100,000) to make the numbers comprehensible?
Or is the problem that percentage is being conflated with probability? I.e. "X% of people will die" is being interpreted as "you have an X% chance of dying", and this (mis)interpretation somehow doesn't happen if we omit the % symbol?
Sybil said,
September 27, 2014 @ 9:56 pm
Late commenting here, but…
Oh how I've longed for this post and its comments (without quite knowing it)! Even though I'd convinced myself that "sensitivity" and "specificity" actually made sense as names for those things, I still always had to look them up when discussing medical testing with my statistics classes. (Every. single. semester.) It's such a great example in some ways, because we all undergo medical testing or know people who have, but the familiarity doesn't translate as well as I'd like into understanding of what the discipline has to offer that our raw intuitions don't give. I think this language problem is at least part of it.
@ Ben Artin: thanks, that's a very useful way of talking and thinking about what the problem is!
MattF said,
September 28, 2014 @ 2:35 pm
And this, I'm afraid, is only the start of the confusion. What about multiple tests? If you 'fail' an initial test and end up in a 'gray' zone, you then get a second test. What information does the second test provide? I have no idea, but a physician will make decisions based on these sorts of results.
Otakar Smrž said,
September 28, 2014 @ 5:53 pm
Just thinking of how a "confusion matrix" gives rise to the "confusion metrics".
Ben Hemmens said,
September 28, 2014 @ 6:32 pm
Most of the doctors dealing with this probably wouldn't understand what you're on about. Becaus they probybly don't have much of a clue what senstivity and specificity refer to in the first place.
Daniel Barkalow said,
September 29, 2014 @ 5:57 pm
"Modal response" is an interesting term for that. Did you mean it as the response which is more common than any other individual response (i.e., the mode), or is it a typo for "model response" (with the same meaning)? Or did you wander into the wrong sort of Structural Analysis conference?
Anyway, on the model of i18n (internationalization) and l10n (localization), I prefer to call specificity "s9y" and sensitivity "s9y", which keeps things short as well as avoiding the need to look them up every time.