Sex and pronouns
« previous post | next post »
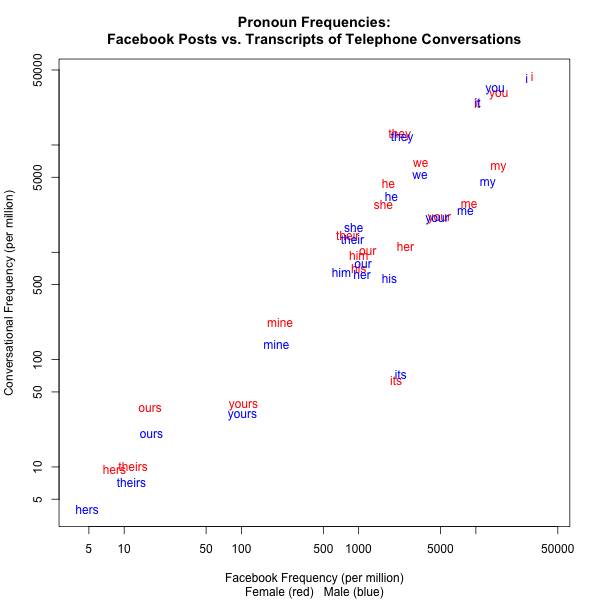
Andy Schwartz recently gave me a copy of word counts by sex and age for the Facebook posts from the PPC's World Well-Being Project. So I thought I'd compare some of the Facebook counts to data from the LDC's archive of conversational speech transcripts. As a start, here's a comparison of rates of pronoun usage in the PPC Facebook sample and in the transcripts of the LDC's Fisher English datasets (combining Part 1 and Part 2).
Overall, the two sources track surprisingly well, considering how different the source contexts are — the correlation is r=0.88. The biggest difference, for "its", probably reflects the fact that Facebook posters often write "its" for "it's".
But let's look into things a bit more deeply. In addition to showing something about men and women and Facebook and telephone conversations, the exploration will offer an opportunity to learn about some useful statistical concepts, at least for those who don't already know all about them.
Here's the associated table of values, showing for each pronoun the frequency per million words in female and male Facebook posts and in the transcripts of telephone conversations:
| Female FB | Male FB | Female CS | Male CS | |
| "he" | 1800 | 1908 | 4370 | 3313 |
| "her" | 2513 | 1071 | 1134 | 628 |
| "hers" | 8 | 5 | 9 | 4 |
| "him" | 1007 | 713 | 944 | 659 |
| "his" | 1004 | 1835 | 705 | 577 |
| "i" | 30222 | 27233 | 43594 | 42230 |
| "it" | 10247 | 10416 | 24606 | 24936 |
| "its" | 2084 | 2291 | 64 | 74 |
| "me" | 8755 | 8165 | 2887 | 2480 |
| "mine" | 214 | 199 | 222 | 140 |
| "my" | 15577 | 12637 | 6503 | 4611 |
| "our" | 1195 | 1092 | 1053 | 786 |
| "ours" | 17 | 17 | 36 | 21 |
| "she" | 1627 | 907 | 2781 | 1702 |
| "their" | 807 | 888 | 1449 | 1324 |
| "theirs" | 12 | 12 | 10 | 7 |
| "they" | 2239 | 2357 | 12879 | 12115 |
| "we" | 3394 | 3358 | 6943 | 5362 |
| "you" | 15663 | 14633 | 31086 | 34208 |
| "your" | 4882 | 4671 | 2149 | 2113 |
| "yours" | 104 | 102 | 39 | 31 |
(A plain text file, suitable for reading into R, is here.)
What should we do with these numbers?
As a start, it's natural to want to turn each pair of male vs. female frequencies into a single number representing the relationship. (We could do the same thing for Facebook vs. conversational frequencies, of course). One obvious way to do that is to look at the ratio between them. Thus for "her", where in Facebook the female frequency was 2513 per million words while the male frequency as 1071 per million words, we get a ratio of 2513/1071 = 2.346. Turning it around the other way, 1071/2513 = 0.426.
In other words, females posting to Facebook (in this sample) used "her" 2.346 times as often as males did — and equivalently, males used "her" 0.426 times as often as females did.
We can think of each normalized frequency as representing the "odds" of that word being used (as opposed to any other word). Thus the frequency of 2513 per million means that the odds of a randomly selected word in female Facebook posts being "her" are 2513 in a million. This is why the usual name for such ratios of frequencies is "odds ratios".
We can compare these odds ratios in tables of numbers:
| Female/Male Odds Ratio |
Male/Female Odds Ratio |
|
| "her" | 2.346 | 0.426 |
| "his" | 0.547 | 1.827 |
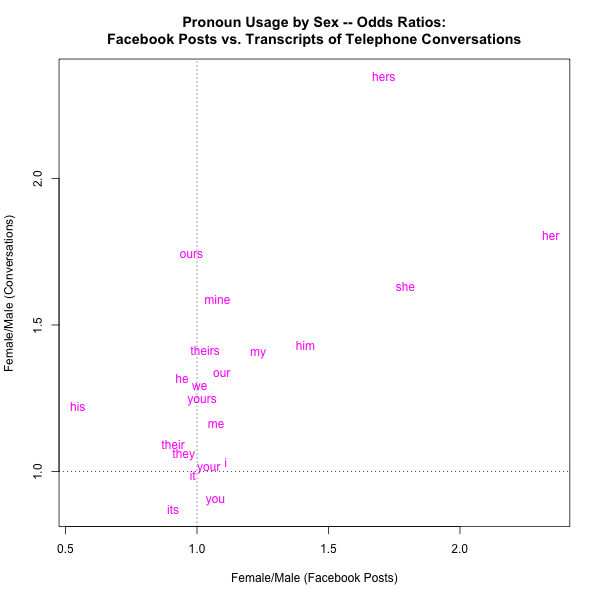
And we can also use odds ratios in graphs. For example, here are two plots intended to compare graphically the sex differences in pronoun usage in our Facebook sample vs. in our sample of conversational telephone speech. The left-hand plot shows the Female/Male odds ratios, while the right-hand plot shows the Male/Female odds ratios:
 |
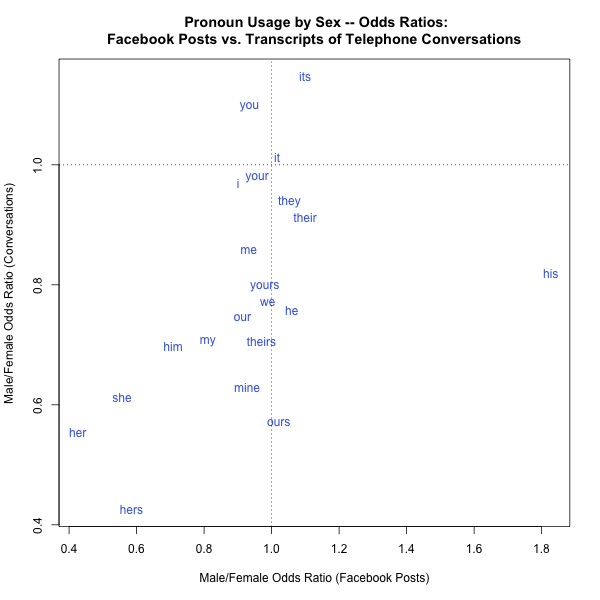 |
As intended, these numbers and plots emphasize male-female differences in ways that the simple frequencies do not. It's not surprising that in both sources, "her" is strongly female-associated while "his" is male-associated. It might be surprising that overall, pronouns seem to be female-associated (though not to those who've read Jamie Pennebaker's The Secret Life of Pronouns).
But one obvious problem with these odds ratios is their asymmetry — it's not as obvious as it should be that e.g. 2.346 and 0.426 are two alternative representations of exactly the same relationship. And another way to see the problem is that if we consider the Male/Female odds, the correlation between Facebook and Fisher is r=0.45, whereas if we look instead at the Female/Male odds, the correlation is r=0.64.
One obvious way to solve this problem is to rely on the fact that
$$\log(\frac{1}{x}) = -\log(x)$$
If we take logs, then the A/B number is always just the B/A number with the sign inverted:
| Female/Male Log Odds Ratio |
Male/Female Log Odds Ratio |
|
| "her" | 0.853 | -0.853 |
| "his" | -0.602 | 0.602 |
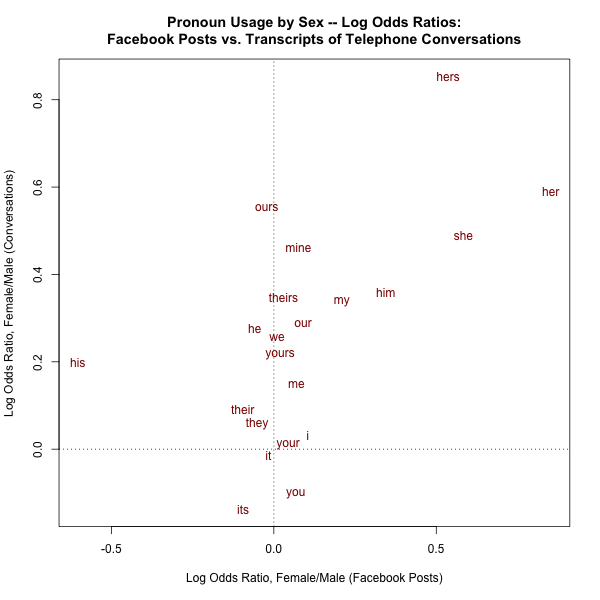
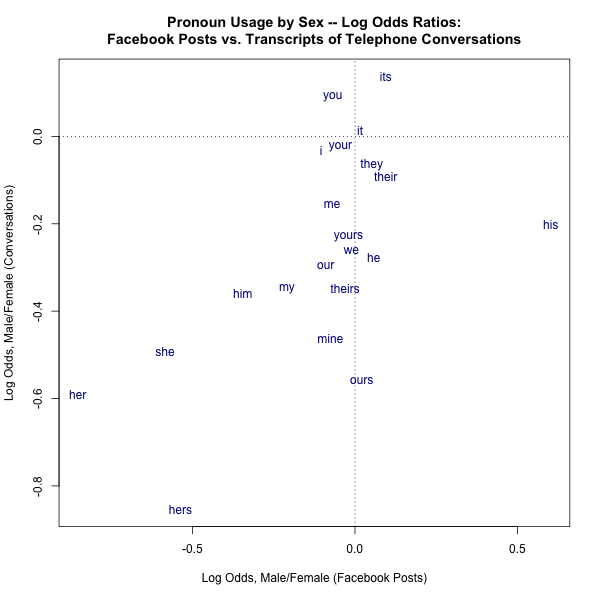
In this framework, correlation in either direction between Facebook and Fisher, whether in terms of Male/Female or Female/Male log odds ratios, is r=0.58.
Similarly, distances from zero become easy to compare via visual perception as well as mental arithmetic:
 |
 |
There are often other good reasons to reason with odds ratios, e.g. in so-called Naive Bayes classifiers or in logistic regression. And there are broader and deeper connections — thus Joshua Gold and Michael Shadlen, "Banburismus and the Brain: Decoding the Relationship between Sensory Stimuli, Decisions, and Reward", Neuron 2002:
In the early 1940's, Alan Turing and his colleagues at Bletchley Park broke the supposedly unbreakable Enigma code used by the German navy. They succeeded by finding in the encoded messages the barest hints of evidence to support or refute various hypotheses about the encoding scheme that they could exploit to determine the contents of the message. Their success rested, in part, on a mathematical framework with three critical components: a method of quantifying the weight of evidence provided by individual clues toward the alternative hypotheses under consideration, a method of updating this quantity given multiple pieces of evidence, and a decision rule to determine when the evidence was sufficient to render a judgment on the most likely hypothesis. […] This framework has been shown to be of general use for making decisions about sequentially sampled data. Recent progress in neurobiology suggests that it may also offer an account of decisions about a different kind of encoded message: the representation of sensory stimuli in the brain.
The "method of quantifying the weight of evidence provided by individual clues toward the alternative hypotheses under consideration" is precisely to treat "weight of evidence" as a log odds ratio — here, for evidence x relative to hypotheses \(h_1\) and \(h_2\)
$$\log (\frac{P(x|h_1)}{P(x|h_2)} )$$
The "method of updating this quantity given multiple pieces of evidence" is simple addition of the log odds ratios for the different pieces of evidence, and the "decision rule to determine when the evidence [is] sufficient to render a judgment" is just comparison of the summed log odds ratios to a threshold.
This is basically the "Naive Bayes" method, which is Bayesian because we use Bayes' rule to relate \(P(h|x)\) to \(P(x|h)\), and "naive" because it naively assumes independence of the various different pieces of evidence.
As noted by Gold and Shadlen (see also "Bletchley Park in the lateral interparietal cortex", 1/9/2004), there are intellectual connections to the history of information theory as well.
But be careful — odds ratios can potentially lead to worse misunderstandings than mere naiveté about statistical independence. See "Thou shalt not report odds ratios", 7/30/2007, for how 84.7 can be misleadingly presented as 60% of 90.6.
That's more than enough for today — but at some point in the future I'll take a look at some other kinds of words and phrases, and at analytic methods like regression.
D.O. said,
August 24, 2014 @ 9:46 pm
But be careful —
Those were different odds ratios. Even the most frequent pronoun has frequency less than 1% and odds=percentage in this case and you have rightly ignored the difference just renaming percentages as odds. Your cautionary tale was about situation where it wasn't so and that was the gist.
[(myl) Indeed. I pointed that out in the linked post, but should have mentioned it in this one, for those who don't follow links.]