Market verbs and market performance
« previous post | next post »
Visiting the New York Times homepage has become rather predictable over the last few weeks. The only question: will the headline scream that the markets are soaring or plummeting?
With the anniversary of Black Monday near (and the prospect of another such Monday looming), I got curious about what financial headlines have been like over the past few decades. The Times search links are amenable to reverse engineering, so I was able to get 23,372 headlines mentioning stocks, markets, dow, nasdaq, from October 13, 1981 to October 13, 2008. This seems like a large enough data set to explore the question, What have the markets been doing since 1981 — or, more accurately, what has the Times been saying that the markets have been doing?
I first tabulated the most frequent verbs appearing in the frame stocks/markets/dow/shares/nasdaq VERB for each of the years. A table listing the top three such verbs for each year is included at the bottom of this post. It is somewhat revealing. For example, up is #1 from 1987-1992, when it is unseated by fall. I suppose this is the move from Wall Street to Clockers. Also, I was surprised that fall won the day even during the first .com era.
However, those rankings are based on low counts in some cases, so I think it is more revealing to move up one level of abstraction. The union of the top 10 verbs from each year has just 52 members, so it was fairly easy for me to sort them by hand into the categories rising, falling, and other:
| Table 1 | |
|---|---|
| rising | advance, climb, gain, jump, rally, rise, soar, surge, up |
| falling | decline, dip, dive, down, drop, fall, lose, lower, plummet, plunge, retreat, skid, slide, slip, tumble |
| other | average, bill, close, continue, drift, edge, end, finish, golf, hold, idle, index, lead, move, note, offer, open, plant, post, profit, question, reach, school, sell, set, steady, take, watch |
I'll say it's a U year when rising verbs outnumber falling verbs, a D year when the reverse is true, and an E year when the counts are equal. Let's see how well the Times' language tracks performance of the Dow:
| Dow performance and the language used to describe it (click to enlarge) |
|---|
 |
(Update 2008-10-15: See below for a more fine-grained look at a small slice of time.)
It looks like a pretty good fit between the language and the market. I find this reassuring in the following sense: few of us have the expertise to interpret the quantitative information in these headlines. Is a 13% gain/loss good, bad, outstanding, miserable, or just another day on the Street? What about a 200 point change? It can be hard to say, so we look to the verbs to determine what the news really is. Geoff Nunberg and I both offered comments on this for a thoughtful NJ Star-Ledger piece last April. I think Geoff nails it when he says that this language helps us move from an unfamiliar quantitative realm to a more familiar qualitative one.
The next step is a closer look at these market verbs. Is there a reliable difference between soaring and plain rising, for example? And, with (the anniversary of) Black Monday approaching, it will be interesting to study the language of market crisis.
| Table 2: Top 3 verbs in stocks/markets/dow/shares/nasdaq VERB sorted by decreasing frequency |
|||||||||||||||||||||||||||||||||||||||||||||||||||||||||
|---|---|---|---|---|---|---|---|---|---|---|---|---|---|---|---|---|---|---|---|---|---|---|---|---|---|---|---|---|---|---|---|---|---|---|---|---|---|---|---|---|---|---|---|---|---|---|---|---|---|---|---|---|---|---|---|---|---|
|
|
||||||||||||||||||||||||||||||||||||||||||||||||||||||||
Update (2008-10-15): The comments provided useful suggestions for how to organize and visualize the information. Here is a graph for fiscal years 1996-1999, which were turbulent and thus rich in headline data. The vertical scale is logarithmic. The predicates below each quarter are the top 3 from that quarter, with the most frequent at the top. As above, U means that the quarter had more positive predicates (according to table 1), D means the quarter had more negative predicates, and E means that the positive and negative counts were the same.
| Dow performance, fiscal years 1996-1999, with top predicates and general trends |
|---|
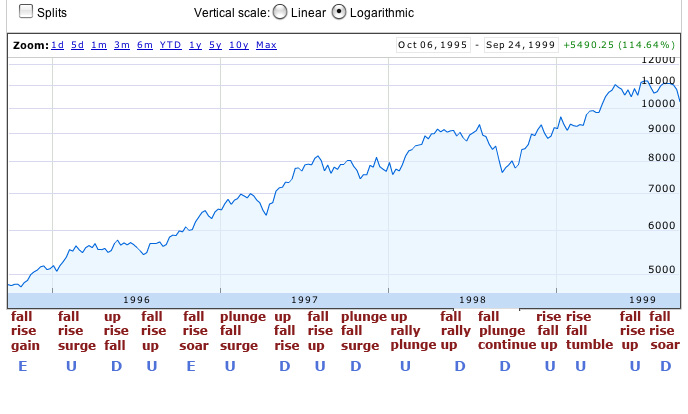 |
Bob said,
October 14, 2008 @ 11:33 am
I think you're grossly misusing language. You said, "It looks like a pretty good fit between the language and the market. I find this reassuring in the following sense: few of us have the expertise to interpret the quantitative information in these headlines."
The actual graph suggests the following:
1. In 1999 and 2000, when the stock market was flat or falling, the headlines speak of an "up" year.
2. In 2001 and 2002, the headlines say down, matching a down market.
3. In 2003, 2004, 2005, and 2006, headlines report a down market, while the market climbs substantially instead.
4. In 2007, the market becomes volatile again, and the headlines say up.
5. In 2008, the down market is accurately described.
Out of the last 10 years, three are accurately described, using your analysis and the letters you assigned to each year. The others are wrong, and in many of the cases inexcusably wrong.
This isn't a "good fit" — from 1995 forward, the headlines are less accurate than coin flips would be.
Jonathan Lundell said,
October 14, 2008 @ 11:34 am
Not that "up" can't be a verb, but it doesn't seem likely in this context.
I'm reminded there there are several euphemisms for a falling market as well: "profit-taking" and "market correction" come to mind. And I conjecture that "drift" is more often than not a down word: "drifted lower".
Janiv Gabbai-Müller said,
October 14, 2008 @ 12:17 pm
"It looks like a pretty good fit between the language and the market."
Does it? Stocks were indeed rising in most of the U-years, but the D-years weren't as bad as their name suggests. In fact, a few of them (namely 1996, 1997, 2003 and 2006) indicate some of the most significant rises in the graph. And consider the period between January of 2001 and December of 2006: after six consecutive D-years the markets should have been, presumably, in a shambles, however, they have actually gained almost 2000 points.
In my opinion, a better conclusion would be that the Times holds an unjustifiably pessimistic point of view. Which is reassuring, in a sense, but not in the sense mentioned in this post.
Chris Potts said,
October 14, 2008 @ 12:54 pm
Bob!
Thanks summarizing your close look at the graph for us. I think you're right to suggest that my interpretation was too pat. It might be better to look at smaller time-slices in greater detail. Some of the generally up periods are marked by high volatility, particularly around 2005, and the overall D could be reflecting the newsworthy drops.
It might be premature to interpret the 2008 numbers. Who knows what's coming …
I'm just getting a feel for what these data are like. I'll aim for a follow-up post when I have a better sense for what they contain.
Chris Potts said,
October 14, 2008 @ 1:11 pm
Jonathan!
Good point. "Market predicates" would have been better. I'm glad I caught 'up' and 'down'.
You seem to be right about the overalls sense of those expressions. There aren't many hits for the phrases you mention, but they are uniform in their senses:
1998-8-28: THE MARKET TURMOIL: THE DOW'S FALL; Major Selloff Leaves a Market Correction Verging on Something Bigger
1999-1-28: Blue Chips Decline 124.35 In a Profit-Taking Session
2000-7-20: Share Prices Slump on Profit-Taking and Rate Concerns
2003-7-25: Profit-Taking Pushes Markets Lower; Dow Falls 81 Points
2003-6-6: Shares Hold Steady as Investors Limit Their Profit-Taking
2006-3-7: Economic Anxieties Contribute to a Day of Profit-Taking
2007-10-3: Shares Close Mixed Amid Profit-Taking
Market drift is generally bad, too, with "drift lower" the dominant idiom, as you suggest.
Tim Silverman said,
October 14, 2008 @ 4:06 pm
I think you should plot this on a logarithmic scale. It's percentage changes that are notable, and the linear scale underplays the exponential rise (and the degree of volatility) in the early part of the graph.
Rubrick said,
October 14, 2008 @ 5:31 pm
"Golf"? Did they really say the market was golfing? What exactly is that supposed to convey?