Retinal sex and sexual rhetoric
« previous post | next post »
This post follows up on my promise ("Sax Q & A", 5/17/2008) to respond to Dr. Leonard Sax's answer to my 2006 critique of the sensory physiology and psychophysics in his 2005 book Why Gender Matters. The first installment, yesterday, was about hearing ("Liberman on Sax on Liberman on Sax on hearing", 5/19/2008). This one is about vision. I'll try to make it shorter, and I'll try to keep it entertaining — but I'll warn you again, this is probably more than you want to know about the subject, unless you're deeply interested in the anatomy and physiology of vision, or in the rhetoric of Dr. Sax's movement.
Why are sensory physiology and psychophysics relevant to single-sex education? Because, as Dr. Sax tells us on p. 28 of Why Gender Matters, "Girls and boys play differently. They learn differently. They fight differently. They see the world differently. They hear differently." And he argues that fundamental biological differences make girls and boys see and hear so differently, even at the sensory periphery, that it's difficult or impossible to teach them effectively in the same classroom.
In a section of Why Gender Matters under the heading "The Eye of the Beholder" (pp. 18-29), Dr. Sax tells us this about the visual system: "Every step in each pathway, from the retina to the cerebral cortex, is different in females and males." And he stresses that these are not small or subtle differences:
The real surprises have come from microscopic analyses of the eye performed in the past five years. Using recently developed techniques, scientists have found that the human retina is full of receptors for sex hormones. Anatomist Edwin Lephart and his associates have found that the male retina is substantially thicker than the female retina. That's because the male retina has mostly the larger, thicker M cells while the female retina has predominantly the smaller, thinner P ganglion cells.
Since M and P cells are believed to constitute two parallel streams of information from retina to cortex, with the M cells dealing mainly with depth and motion, while the P cells specialize in with color and edges, you can see why this would imply a big sex difference in seeing. And, Dr. Sax tells us,
We're not talking about small differences between the sexes, with lots of overlap. We're talking about large differences between the sexes, with no overlap at all. [emphasis added]
But the studies he cites (and the graph he shows) turn out to be about sexual dimophism in the retinas of rats. And with a little web search, I turned up some studies showing that humans are apparently very different from rats in this respect — the relevant retinal thickness measurements for human males and females differ in means by a small ratio, and overlap a great deal. I said so in my 2006 posts "Of rats and women", 8/19/2006, and "More on rats and men and women", 8/22/2006. And as you'll see below, the reference that Dr. Sax himself now cites as the most relevant one shows about a three percent average difference between human boys and girls in retinal thickness, in the most sexually-dimorphic of the available measurements, with the considerable overlap of distributions associated with an effect size of 0.2.
A couple of months ago, the National Association for Single Sex Public Schools posted a response from Dr. Sax (available in .pdf form here). He complains that
Your discussion focuses almost entirely on measurements on retinal thickness, as though my argument rested critically on measurements of retinal thickness, or on the magnocellular/ parvocellular distinction. Once again you miss the forest for the trees. In chapter 2 of Why Gender Matters I tried to present, and perhaps to account for, some fairly robust findings regarding sex differences in vision.
But I wasn't attempting a general review of human sex differences in vision. I was trying to evaluate whether Dr. Sax's presentation of scientific research can be trusted. His points about differences in retinal thickness and magnocellular/parvocellular distributions, at the start of his book's section on vision, seemed incredibly striking and persuasive. I was genuinely impressed, until I looked into the matter and discovered that what he said might be true of rats but is definitely not true of humans.
This doesn't mean that his other points about the visual system are wrong. But it does mean that no one should trust them without looking them all up and checking them carefully.
Later in the letter, he writes:
[Y]ou are writing a (purportedly) scholarly post, specifically attacking me on a matter of empirical fact, namely, retinal thickness in humans. Accordingly, I am sure you will agree that you had an affirmative duty (as a lawyer might say) to cite all the relevant evidence, not merely the one study which happens to support your position.
Actually, I was trying to determine whether Dr. Sax's striking claim, about what turned out to be rat data, was relevant to humans. I didn't select among the available papers — I simply took the first reasonably recent paper that Google scholar gave me, in August of 2006, that had a decent number of subjects and some details about the distributions. But he goes on in his letter to give a list of other studies that he feels I should have considered:
As near as I can tell, six studies of retinal thickness in living humans have found a statistically significant difference between males and females, with males having thicker retinas.
Those six studies are (alphabetically, by first author):
1) Asrani S, Zou S, d’Anna S, Vitale S, Zeinier R. Noninvasive mapping of the normal retinal thickness at the posterior pole. Ophthalmology 1999; 106: 269-73.
2) Hee MR, Puliafito CA, Duker JS, et al. Topography of diabetic macular edema with optical coherence tomography. Ophthalmology 1998;105:360–370.
3) Huynh SC, Wang XY, Rochtchina E, Mitchell P. Distribution of macular thickness by optical coherence tomography: findings from a population-based study of 6-year-old children. Investigative Ophthalmology & Visual Science, 2006;47:2351-2357. (This study is of particular interest because it is the only one which surveyed children rather than adults.)
4) Massin P, Erginay A, Haouchine B, Ben Mehidi A, Paques M, Gaudric A. Retinal thickness in healthy and diabetic subjects measured using optical coherence tomography mapping software. European Journal of Ophthalmology, 2002;12:102-108.
5) Wakitani Y, Sasoh M, Sugimoto M, Ito Y, Ido M, Uji Y. Macular thickness measurements in healthy subjects with different axial lengths using optical coherence tomography. Retina. 2003;23:177–182.
6) Wong AC, Chan CW, Hui SP. Relationship of gender, body mass index, and axial length with central retinal thickness using optical coherence tomography. Eye. 2005;19:292–297.
I summarize the evidence from all of these studies below, and give a complete table of values and effect sizes. And these results lead to exactly the same conclusion that I derived from Wakitani et al. in 2006. But let me stress, to start with, that the issue is not whether the sex difference in retinal thickness is statistically significant, but whether it's educationally significant.
Dr. Sax writes that
The sex difference is least striking in Wakitani et al., which is – curiously – the only one of these six references which you cite. By contrast, Wong et al. (2005) found no overlap at all between male and female confidence intervals: see figure 2 of their paper, which is [shown below].
Actually, the effect sizes for sex differences in Wakitani et al. (0.44, 0.41, 0.43 for three concentric areas of different diameters) are similar to those in Wong et al. (0.65 for the central 1 mm and 0.27 for the fovea), and substantially larger than those in Huynh et al. (0.15 for the fovea and 0.20 for the central macula).
More important, there's an enormous conceptual difference between the range of a sample of numbers (which, his book claimed, don't overlap at all in human retinal thickness distributions) and the confidence interval for an estimate of the mean of the population underlying the sample. As sample sizes increase, the confidence intervals around two estimated means go to zero, no matter how much the underlying distributions may overlap.
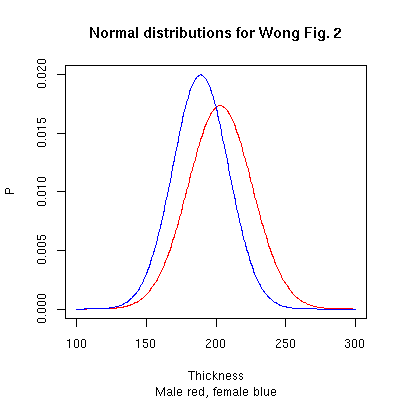
Consider two normal distributions defined by the parameters estimated by Wong et al. for the data in the figure that Dr. Sax provides: male mean=203, s.d.=23; female mean=189, s.d.=20. The overlap of population distributions for normal distributions with these parameters looks like this:
As the Wikipedia article explains, assuming a normal distribution, we can estimate the 95% confidence interval as the sample mean plus or minus 1.96 σ / √n. With σ=23, as in the case of Wong et al.'s male subjects, this will be ±14.3 for N=10, ±6.4 for N=50, ±1.4 for N=1,000, ±0.45 for N=10,000.
As N increases, the population distributions (and their degree of overlap) remain identical. It's just that sampling error becomes smaller and smaller, so that we can become more and more confident of what the population mean value actually is (assuming unbiased sampling, etc., etc.). In this case, given that the estimated means of the two distributions are 14 units apart, and the standard deviations are 23 and 20, the confidence intervals will stop overlapping before N gets to 50. But that's doesn't make it true that "We're talking about large differences between the sexes, with no overlap at all."
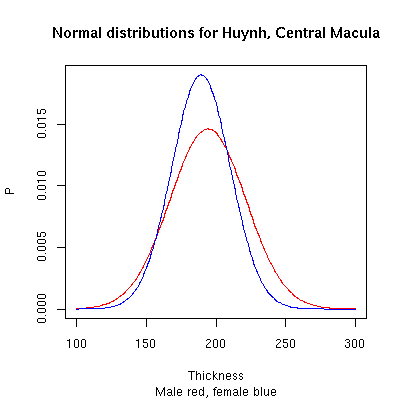
For a better-supported picture of the overlap of population distributions for retinal thickness in school-aged children, the corresponding normal-distribution plot for the parameters estimated for the central macula in Huynh et al. 2006 (male mean=194.2, sd=27.3; female mean=189.3, cd=21.0) looks like this:
But again, this is surely not what we should expect if Dr. Sax's assertion about retinal thickness (and by extension, the rest of visual physiology) in Why Gender Matters were true:
We're not talking about small differences between the sexes, with lots of overlap. We're talking about large differences between the sexes, with no overlap at all.
In fact, what we're talking about is exactly a small difference between the sexes in mean values — about 3% — with a great deal of overlap in the distributions. Still, the confidence intervals for our estimates of the means will become non-overlapping if N gets big enough. And in this case, as shown in Huynh et al.'s Table 4 below, the confidence intervals are indeed non-overlapping, since N=789 for boys and N=754 for girls. Specifically, Huynh et al. specify a .95 C.I of 192.3-196.1 μm for boys, and 187.9-190.8 μm for girls.
As you can see from the plot above, these "confidence intervals" are not at all the same as the range of values, or the interquartile range of values, or any other way of thinking about the distribution of individual boys' and girls' measurements. They do tell us that the difference in estimated mean values is a "significant" one, in the statistical sense of being very unlikely to have occurred by chance in independent samples from the same population. But they don't tell us whether the difference is a significant one in any practical sense — for example, in the sense that boys and girls see the world so differently that entirely different educational methods are motivated. On the contrary, a 3% difference in means, with the degree of overlap that a .20 effect size implies, doesn't support such an inference at all.
Dr. Sax's letter to me continues:
This figure [the display of confidence intervals from Wong — myl] is of course reminiscent of the figure from Salyer, Lephart et al. (2001) which I cite on p. 21 in Why Gender Matters, and which you attacked with such fury.
My emotion was closer to bemusement than to fury, though I'll agree that such extreme misuse of scientific evidence by someone with excellent scientific credentials is worthy of some moral censure. And I'm bemused, yet again, by the repeated implication that lack of overlap of calculated confidence intervals is the same thing as lack of overlap of the distributions of measurements.
Returning to Dr. Sax's list of citations, a bit of web search via Google scholar suggests that there are many other recent studies, besides the six that he offers, which measure human retinal thickness using OCT and similar methods. I 've added to Dr. Sax's list the first one I found that gives male and female measurements (J. Funk and B. Alamouti, "Retinal thickness decreases with age: an OCT study", British Journal of Ophthalmology. 87(7):899-901, 2003), to make up for the fact that I couldn't access Massin et al. 2002 on line (I've ordered it via interlibrary loan and will add the data when it comes in.)
The results of checking these six references are shown in a table linked here (it's too wide to fit comfortably in this format).
Without doing a formal meta-analysis, the pattern seems pretty consistent — human males' central retinas are, on average, somewhat thicker than females, by something less than 6 or 7 percent (compared to an overall size difference of about 9 percent in long bone dimensions, FWIW). The within-group standard deviation is about 4% to 20% of the mean, so that the estimated effect size ends up between 0 and 0.7 (except for Asrani 1999, the oldest and smallest study, with only 7 or 8 measurements per category, and standard deviations half the size of those in all the other studies).
The most relevant, the most recent, and also by far the largest study is Huynh 2006, which attempted to measure all the students in a school cohort in Sydney, Australia. In this study, the biggest difference in mean values between boys and girls of a dozen different measurements of retinal thickness was about 3%, with an effect size of 0.20 — which is a small effect, with a large amount of overlap.
But there's a more interesting point in the Huynh et al. study. They also compared "Whites" and "East Asians". Below, I've reproduced their Table 4 (comparing boys and girls) and Table 5 (comparing whites and asians). As you can see, the largest difference between the ethnic groups is considerably larger than the largest difference between the sexes. It's about twice as great: 9.3 μm for the ethnic difference in the central macula, vs. 4.9 μm for the sex difference in the same measurement:
I trust that this — along with the hint in Asani 1999 of a similar difference for whites vs. blacks — will not inspire Dr. Leonard Sax to start a National Association for Single Race Public Education.
In his letter, Dr. Sax stresses that he's really interested in overall sex differences in visual perception and cognition, not in retinal thickness:
As I stressed in my previous letter: my primary interest and motivation is to understand what’s really going on here. Maybe sex differences in retinal thickness are important; maybe they are not. The important questions are (for example): why do baby girls prefer faces over mobiles, while baby boys prefer mobiles over faces? Why do so many young girls prefer to draw colorful pictures of people, pets, and flowers, while many boys prefer to draw action scenes with less color contrast and less detail (such as facial features)? I cite this research in chapter 2 of Why Gender Matters, but you never respond to these substantive issues, preferring to devote almost your entire post to the question of retinal thickness, which is certainly secondary to the main question.
OK, but I was not (and am not) trying to make a general argument about sex and vision. As I stressed in my earlier posts, I was (and am) trying to evaluate whether Dr. Sax's presentation of scientific evidence, in his book Why Gender Matters and elsewhere, can be trusted. My conclusion continues to be "no".
[However, if you're still following along, an evaluation of the research on drawings and mobiles can be found here: Innate sex differences: science and public opinion, 6/20/2008.]