UM UH 3
« previous post | next post »
[Warning: More than usually wonkish and quantitative.]
In two recent and one older post, I've referred to apparent gender and age differences in the usage of the English filled pauses normally transcribed as "um" and "uh" ("More on UM and UH", 8/3/2014; "Fillers: Autism, gender, and age", 7/30/2014; "Young men talk like old women", 11/6/2005). In the hope of answering some of the many open questions, I decided to make a closer comparison between the Switchboard dataset (collected in 1990-91) and the Fisher dataset (collected in 2003).
I used the Mississippi State 1998 re-transcription of Switchboard, and the Fisher English Training Set Part 1 and Part 2 transcripts, as published by the LDC. For this comparison, I used only those Fisher conversation sides where the post-hoc call auditing agreed with the nominal speaker's registered demographic information.
The general pattern is consistent: females on average use more UMs than males, while males on average use more UHs than females. But the actual rates are quite different. Overall (UM+UH) rate in Switchboard was 2.80%, versus 1.64% in Fisher.
The breakdown by UM vs. UH and male vs. female shows a similar and consistent difference in base rates, along with a consistent pattern of sex differences:
| NWords | UM% | UH% | (UM+UH)% | UM/UH | UM/(UM+UH) | ||
| SWB | Males | 1.6M | 0.53% | 2.85% | 3.37% | 0.19 | 0.16 |
| Females | 1.6M | 0.77% | 1.42% | 2.20% | 0.54 | 0.35 | |
| Fisher | Males | 7.9M | 0.85% | 1.03% | 1.87% | 0.829 | 0.45 |
| Females | 10.8M | 1.04% | 0.42% | 1.47% | 2.421 | 0.71 |
Why the large difference in overall filler-word rates?
Logically, the cause might be a change in linguistic norms over the course of 12 years; a difference in the conversational setting; a difference in the sample of speakers; or difference in transcription practices.
The "age grading" of UM/UH ratios might suggest that there's some change in progress in relative UM vs. UH usage, but I think it's out of the question that overall rates of filler-word usage decreased by more than 40% in 12 years.
There are some differences in the demographics of the speaker samples for Switchboard (for which speakers were recruited at Texas Instruments in Dallas) and Fisher (for which speakers were recruited at Penn in Philadelphia), though in both cases an effort was made to get a broad demographic and socioeconomic sample. Since location and years-of-education information is available for speakers in both datasets, it will be possible to explore this issue further to some extent.
The conversational setting was pretty much identical for the two collections: a telephone conversation with a stranger on an assigned topic (which both speakers have chosen as a topic they're willing to discuss). Many of the topics were even the same. One perhaps-relevant difference is that 99% of Fisher participants made 3 or fewer calls, whereas 46% of Switchboard participants made more than 10 calls, and only 22% made 3 or fewer calls. It's possible that participating in your fifth or tenth or 15th call might put you in a frame of mind where filler-words come easier.
And finally, the transcriptions were done at different times by different groups of people using different technological support. There's a general tendency for transcribers to edit out various sorts of disfluencies, including filled pauses. This is first because human verbal memory tends to ignore disfluencies even when a listener is trying to register them accurately, and second because transcribers often learn to omit disfluencies in order to improve readability, even when they hear and remember them. In both the Switchboard and Fisher transcripts, transcribers were instructed to record filled pauses accurately, but (especially in the case of Fisher) there was an emphasis on transcription speed as well. So it's plausible that a difference in transcription practices might have contributed to the cited difference in overall base rates of filler-word usage.
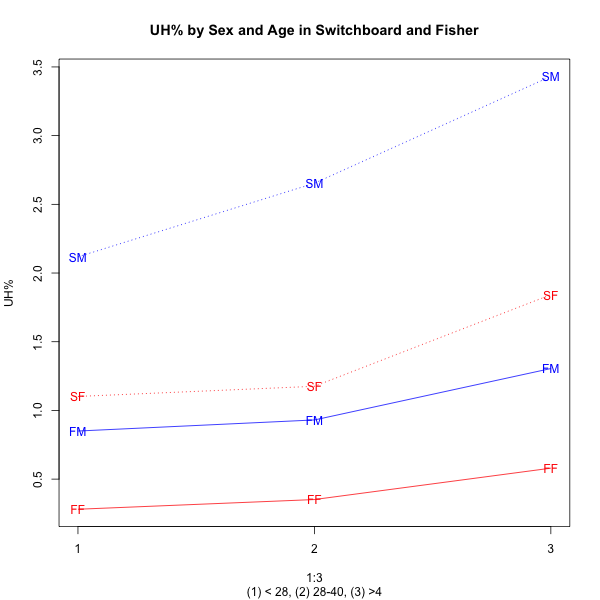
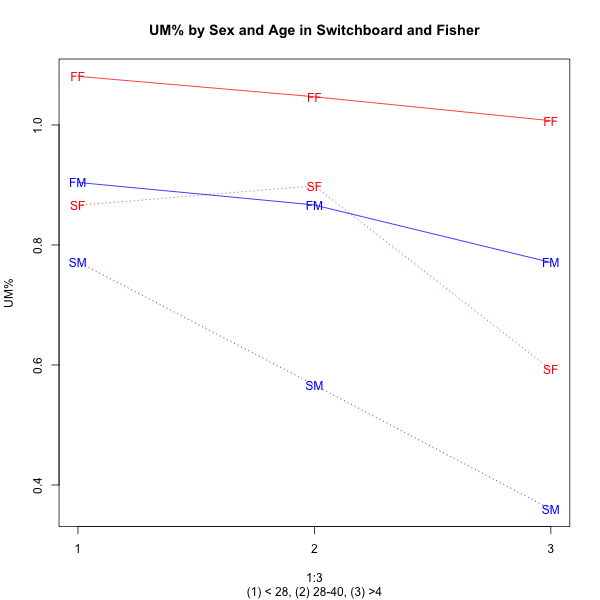
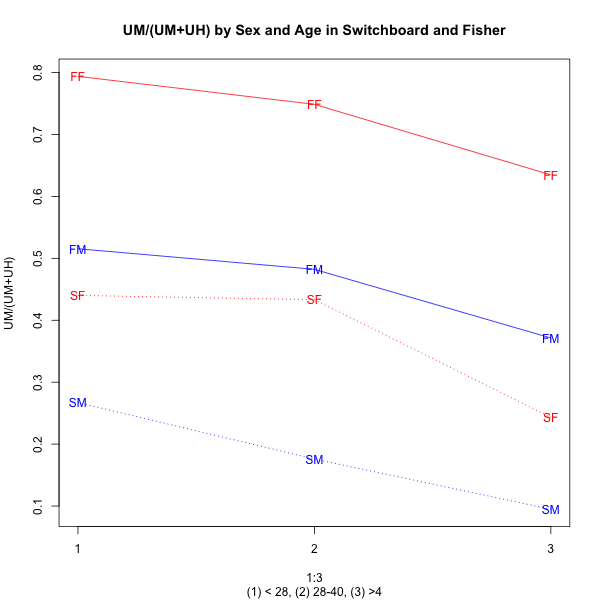
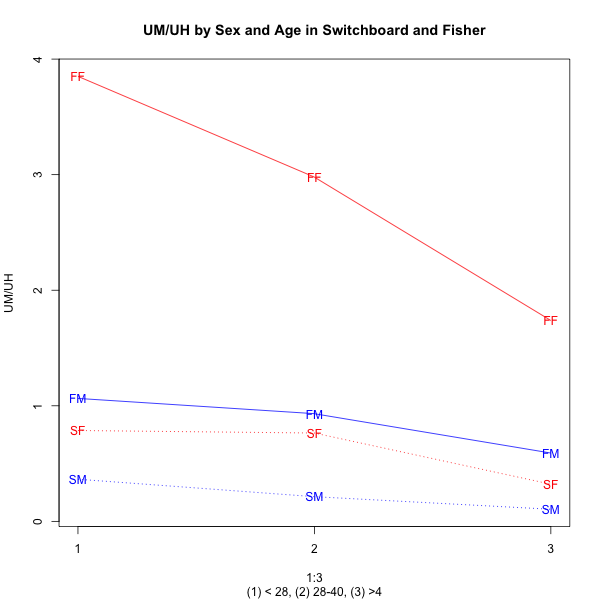
If we go on to divide things up by speaker age as well, the same sort of relationship applies — effects of sex and age in a consistent direction, along with a large overall difference between the two datasets:
| NWords | UM% | UH% | (UM+UH)% | UM/UH | UM/(UM+UH) | ||
| SWB | M <28 | 323,354 | 0.77% | 2.12% | 2.89% | 0.36 | 0.27 |
| M 28-40 | 690,197 | 0.57% | 2.65% | 3.22% | 0.21 | 0.18 | |
| M >40 | 630,525 | 0.36% | 3.43% | 3.79% | 0.10 | 0.09 | |
| F <28 | 227,919 | 0.87% | 1.10% | 1.97% | 0.79 | 0.44 | |
| F 28-40 | 758,063 | 0.90% | 1.18% | 2.07% | 0.76 | 0.43 | |
| F >40 | 629,251 | 059% | 1.84% | 2.43% | 0.32 | 0.24 | |
| Fisher | M <28 | 2,864,748 | 0.90% | 0.85% | 1.75% | 1.06 | 0.52 |
| M 28-40 | 2,485,236 | 0.87% | 0.93% | 1.80% | 0.93 | 0.48 | |
| M >40 | 2,594,691 | 0.77% | 1.36% | 2.08% | 0.59 | 0.37 | |
| F <28 | 2,449,683 | 1.08% | 0.28% | 1.36% | 3,85 | 0.79 | |
| F 28-40 | 3,921,668 | 1.05% | 0.35% | 1.40% | 2.98 | 0.75 | |
| F >40 | 4,420,213 | 1.01% | 0.58% | 1.57% | 1.74 | 0.63 |
In graphical form ("FF" is Fisher females, "FM" is Fisher males, "SF" is Switchboard females, "SM" is Switchboard males):
 |
 |
The overall UM/(UM+UH) proportions, and the UM/UH ratios by age and sex, again show similar trends in the two datasets, but quite different actual values:
 |
 |
It's possible that a more systematic statistical model, allowing for all available factors, would clear this up. But I suspect that more elaborate modeling, though a good thing to do, wouldn't succeed in explaining these differences between the datasets, unless dataset identity is one of the factors.
Since the original recordings have also been published, we could compare a sample of re-transcribed material to evaluate the effect of transcription practices — for those interested in filler-word usage, this would be worth doing.
Russell said,
August 4, 2014 @ 8:39 pm
Not all these conversations stay to the assigned topic, and anecdotally, from listening to a bunch of conversations from both corpora (and later being a participant), there can be severe cases of asymmetry in interest in the topic, or even in really being a participant in the call.
Perhaps there is a difference between SWB and Fisher (either in the recruiting methodology or demographics of the participants) that leads to different types of discourse with different baselines for um/uh frequency. I don't suppose there is ready annotation of these things (which portions of the call were on-topic, was there an "expert", etc)?