Interactive visualization for computational linguistics
« previous post | next post »
I didn't make it to ACL2008 back in June, but Ani Nenkova, who was the tutorials chair, recently sent me a link to some really terrific slides from a tutorial by Christopher Collins, Gerald Penn and Sheelagh Carpendale on "Interactive Visualization for Computational Linguistics". (Warning: it's a 13.8 MB .pdf file).
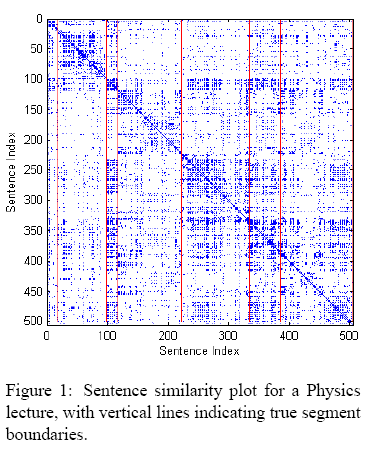
Here's their first figure:
And here's one from p. 141:
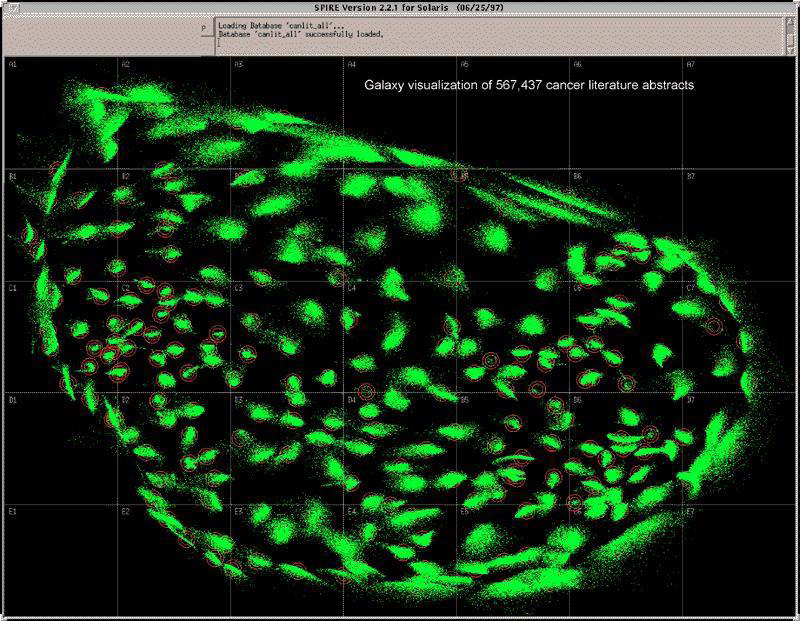
(click for a larger version.)
Of course there are Wordle-like things as well, but I really like the idea of 567,437 cancer abstracts viewed as clusters of stars. Though that particular picture looks more like a fluorescein-stained micrograph…
Visualizations — The Ideophone said,
November 7, 2008 @ 9:45 am
[…] Language Log, a nice tutorial titled Interactive Visualization for Computational Linguistics [PDF, 13,1 Mb] by […]
Jonathan Badger said,
November 10, 2008 @ 2:53 am
The sentence similarly plot is exactly the same visualization as a dot plot of alignments used in bioinformatics (probably produced by software designed for bioinformatics)
[(myl) yes — see Ken Church and Jonathan Helfman, "Dotplot: a program for exploring self-similarity in millions of lines of text and code", 1993; and the discussions of common-subsequence algorithms in Joseph Kruskal and David Sankoff, eds., Time Warps, String Edits, and Macromolecules: The Theory and Practice of Sequence Comparison, 1983.]