More on conversational dynamics
« previous post | next post »
Following up on "The dynamics of talk maps" (9/30/2022), I created and parameterized such representations for the published CallHome conversations in Egyptian Arabic, American English, German, Japanese, Mandarin, and Spanish. The goal was mostly just to set up and debug an analysis pipeline, including the extraction of 14 first-guess parameters per conversation, on the way to analyzing the much larger set of much more diverse conversational data that's available.
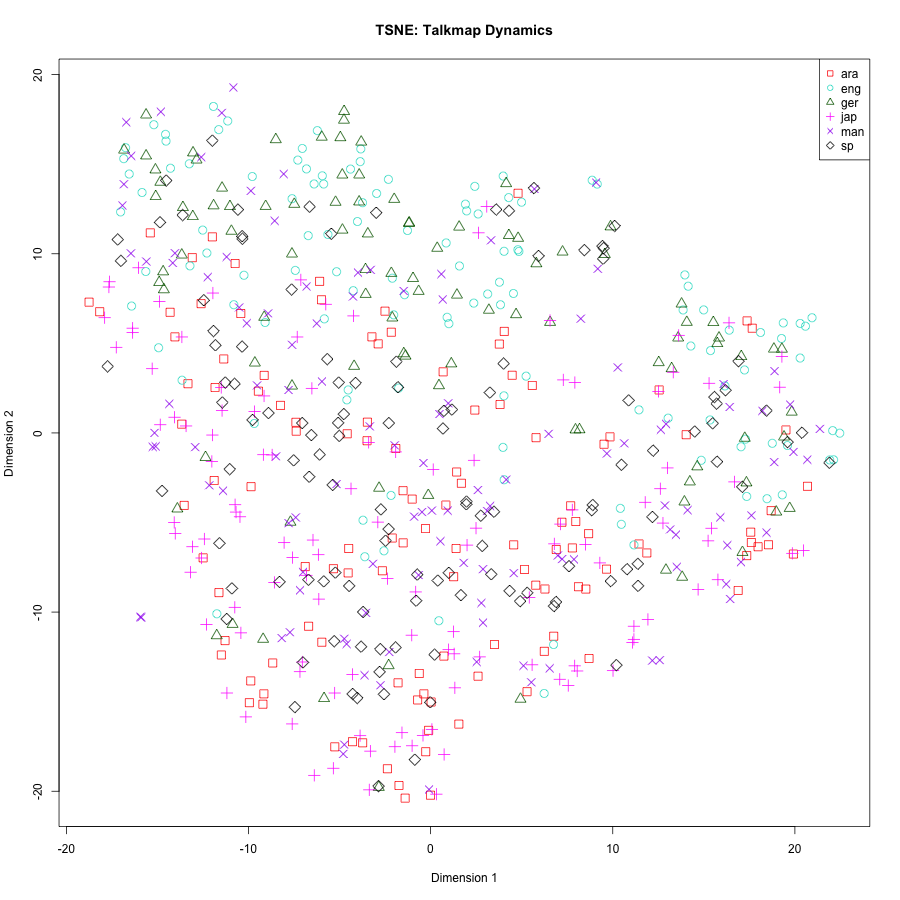
But just for fun, I used t-SNE to reduce the 14 dimensions to 2 for visualization purposes. I didn't expect much, but some differences emerged in the distribution of points for conversations in the different languages:
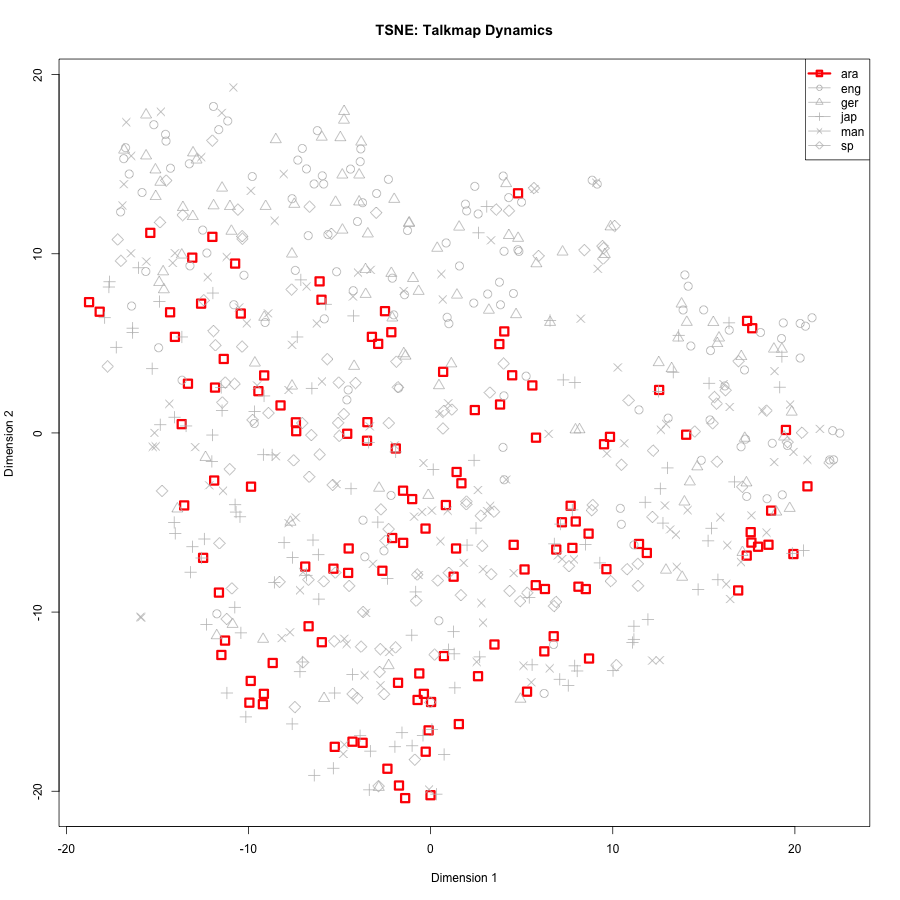
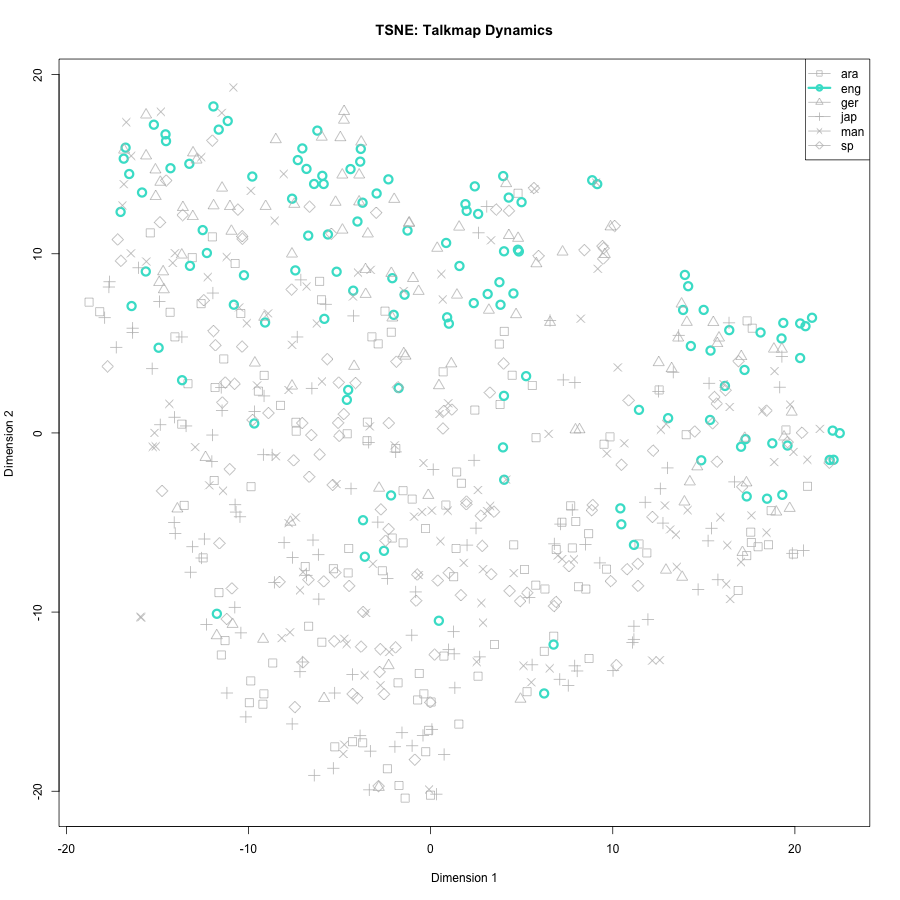
Bringing out one language at a time, we can compare Arabic and English:
 |
 |
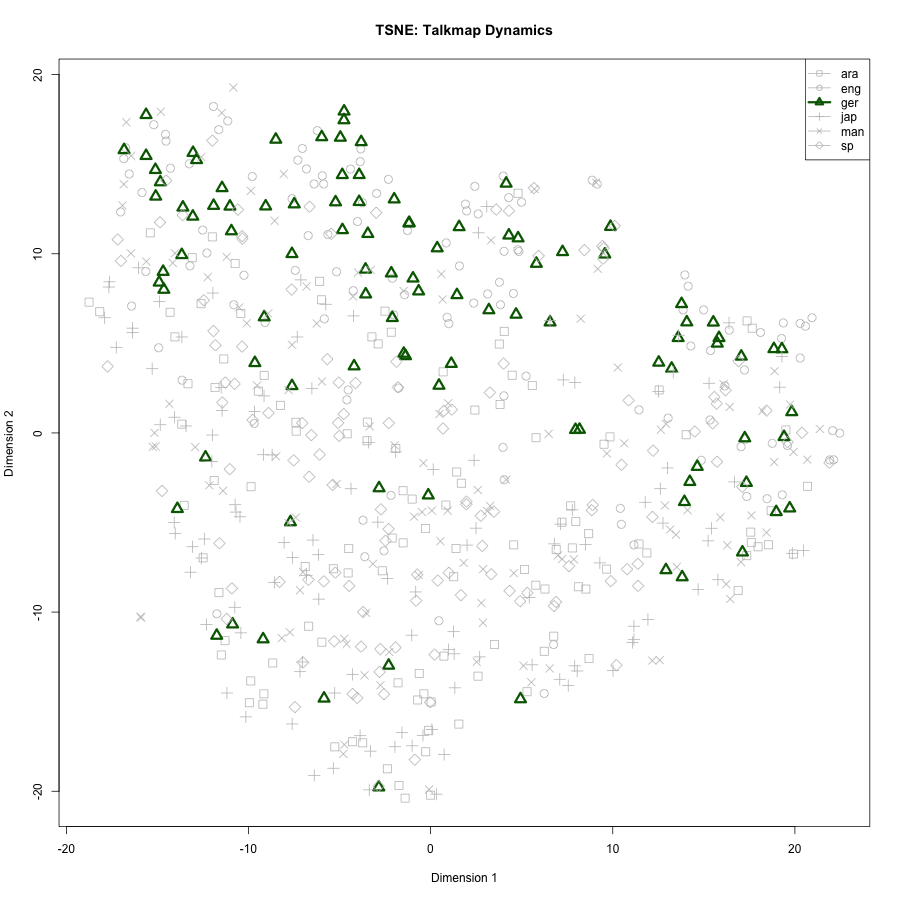
Or German and Japanese:
 |
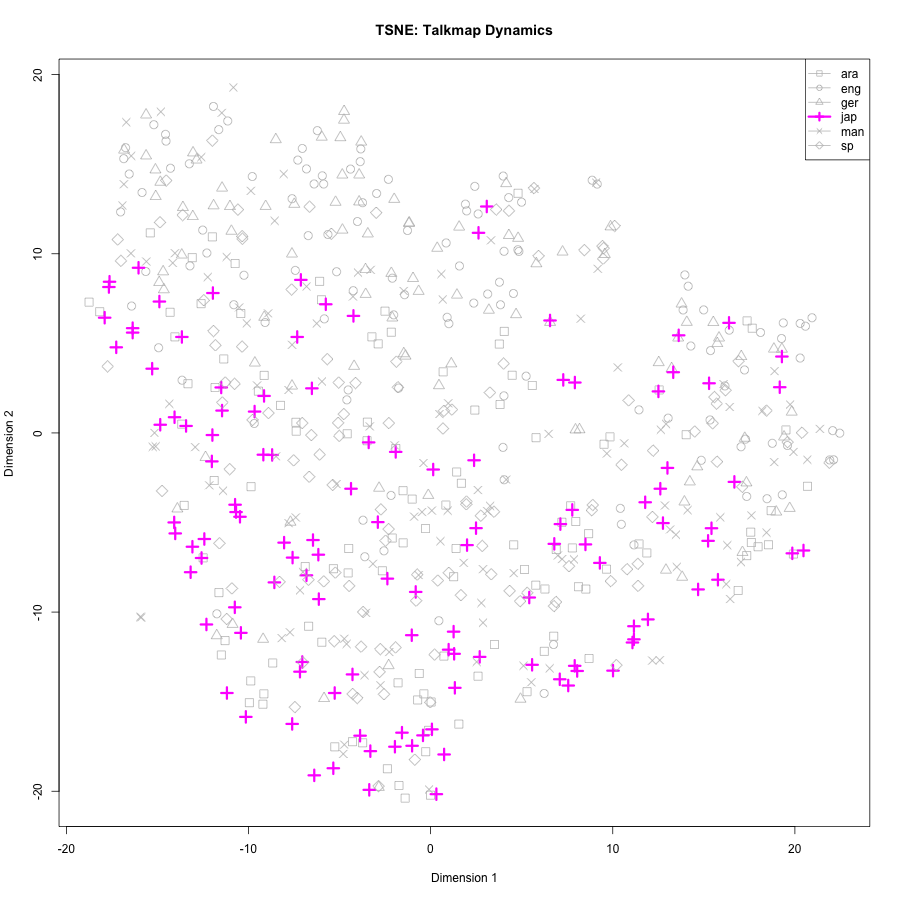 |
I have no idea what the two t-SNE dimensions mean, if anything. But I'm hopeful that spaces emerging from variants of this analysis will reflect differences in conversational tone and style — especially if combined with features representing aspects of content, as well as simply who spoke when.
Perhaps we can define a replicable and interpretable space of conversational dynamics. and learn how different types of people and different types of interactions move around in that space.
Jerry Packard said,
October 2, 2022 @ 9:36 pm
To figure out what the two dimensions mean, would it help to know how the original 14 factors are distributed within the two dimensions?
Yuval said,
October 3, 2022 @ 12:09 am
@Jerry: t-SNE doesn't really work that way. It optimizes for distance between near neighbors in the original space.
[(myl) Indeed. At some point I should try old-fashioned linear dimensionality-reduction techniques, where Jerry's question has a precise answer.
But that will make more sense after I add the next dozen talkmap (and other) features, bring in analysis of more different types of conversational data, and consider participant metadata like age, gender, etc. In particular, there are larger collections where the same speaker participates in multiple conversations with different partners, so that individual characteristics can be tracked. ]
NSBK said,
October 3, 2022 @ 8:21 am
I have only recently learned about t-SNE, but in the realm of immunology, where a target data-set may represent the prevalence of certain biological markers found on individual cells in a blood sample — i.e., each row is for a particular blood cell and each column is for a particular marker, the entries quantifying "how much of this marker was found on that blood cell". The combinations of presence and absence for particular markers can indicate what type of blood cell was measured (was this a T-cell or a B-cell or … etc). This can help quantify differences between different samples, maybe comparing before and after a vaccine was administered, or between different days over the course of an illness, or a million other types of analysis.
That's all to say — those t-SNE visualizations differentiate between populations of cells, whereas the ones in this post differentiate populations of people. I mostly work in computer science, so it's very interesting (to me) to see the various applications of clustering algorithms. I also sometimes wonder how much we humans lose out on by not truly being able to directly comprehend more than 2 or 3 dimensions.
If anyone's curious about those visualizations of biology data, here is a page from one of the many products on the market that can do that type of analysis:
– https://support.cytobank.org/hc/en-us/articles/223521168-Analysis-and-interpretation-of-the-dimensionality-reduction-DR-results