Macronic and Trumpish prosody
« previous post | next post »
More clearly, the prosody of French president Emmanuel Macron and American president Donald Trump, as exhibited on one occasion, and presented in some eccentric (but I think interesting) graphics.
The occasion is the post-G7 press conference on August 26, 2019. The eccentric presentations are two-dimensional distributions of pitch differences as a function of time differences ("dipole plots"), and two-dimensional distributions of rates of pitch change and rates of amplitude change. These plots have been discussed from time to time earlier on LLOG, e.g. in "Some visualizations of prosody", 10/23/2016.
Here are President Macron's opening remarks:
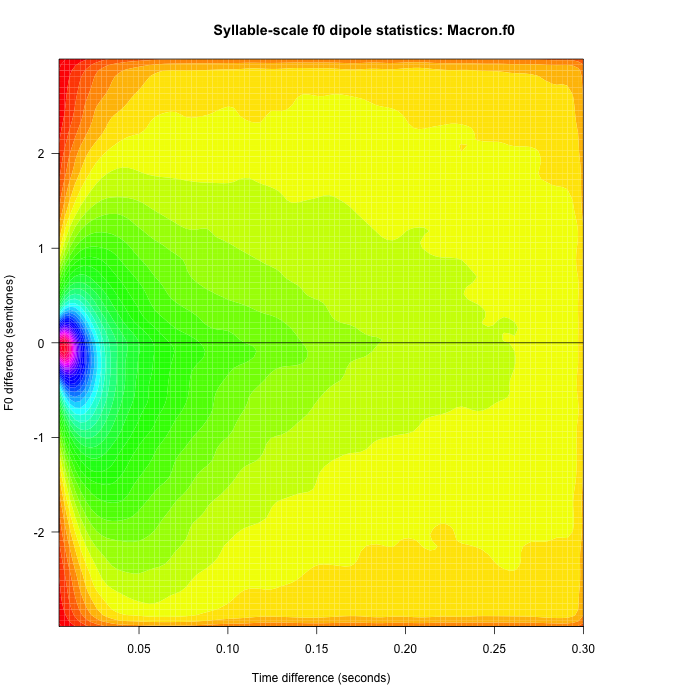
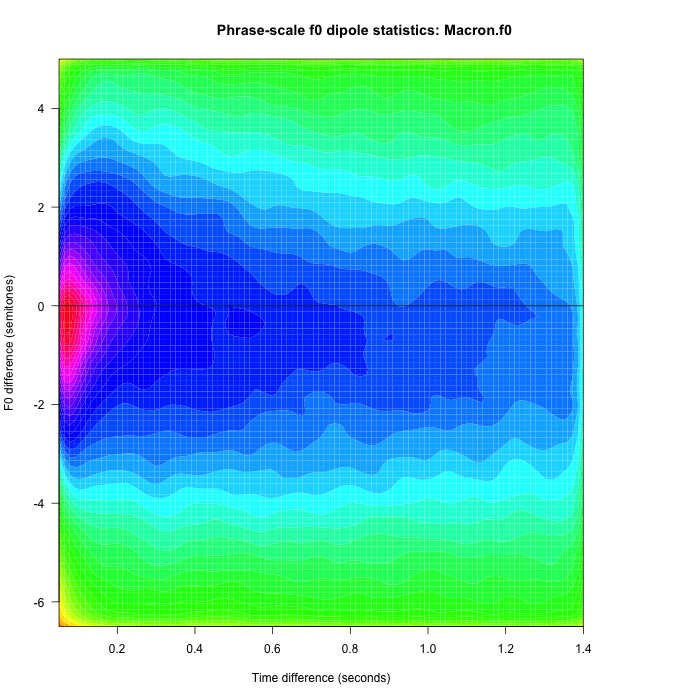
The corresponding syllable-scale and phrase-scale f0 dipole plots:
 |
 |
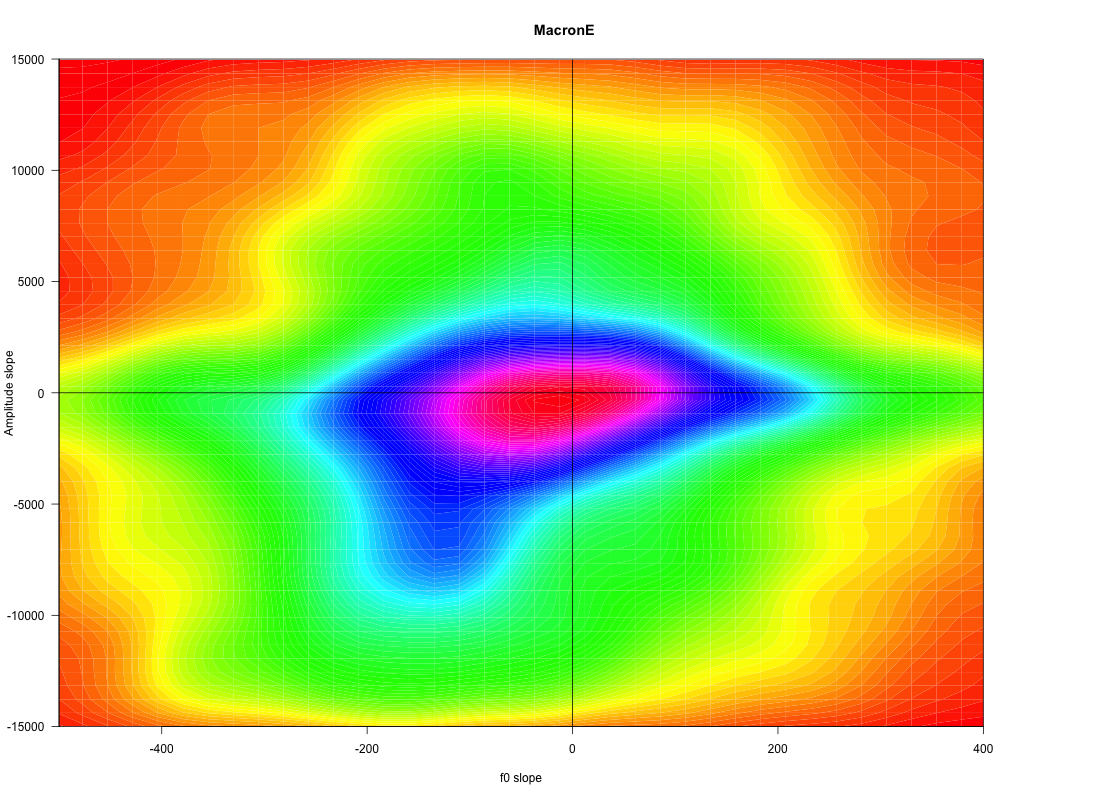
And the (syllable-scale) plot of delta f0 and delta amplitude:
President Trump's opening remarks:
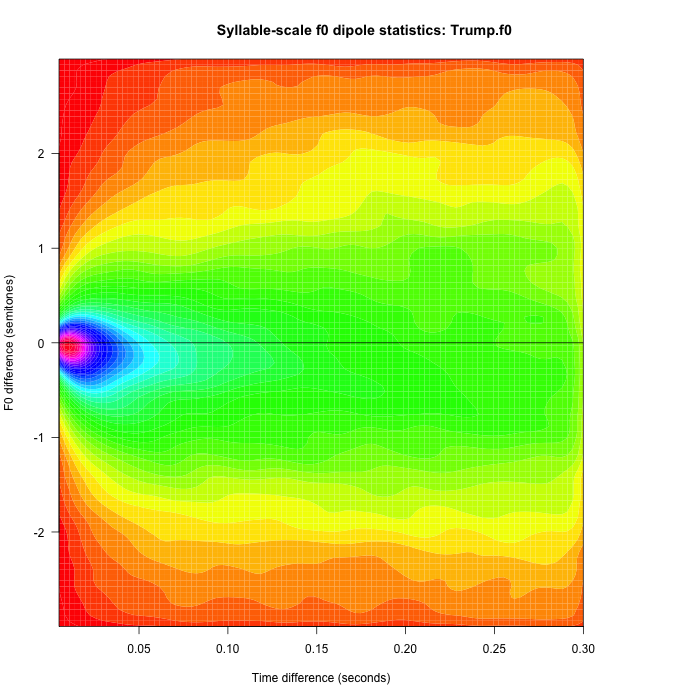
The corresponding syllable-scale and phrase-scale dipole plots:
 |
 |
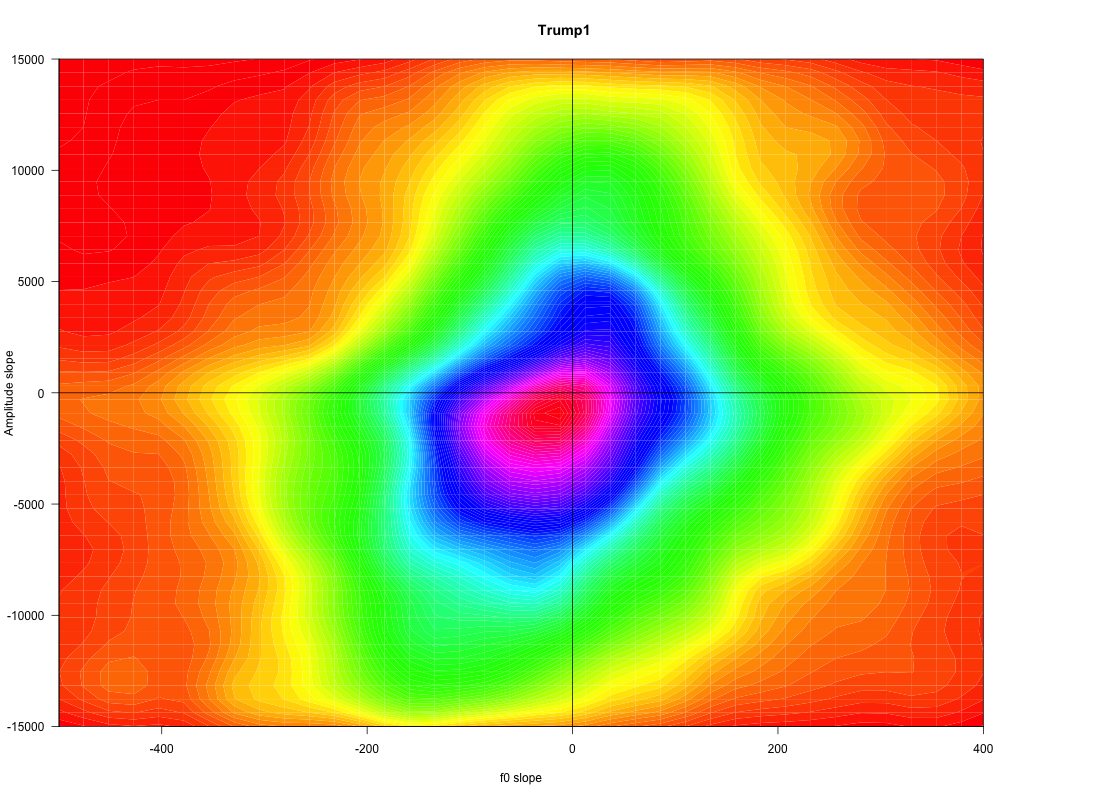
And the (syllable-scale) plot of delta f0 and delta amplitude:
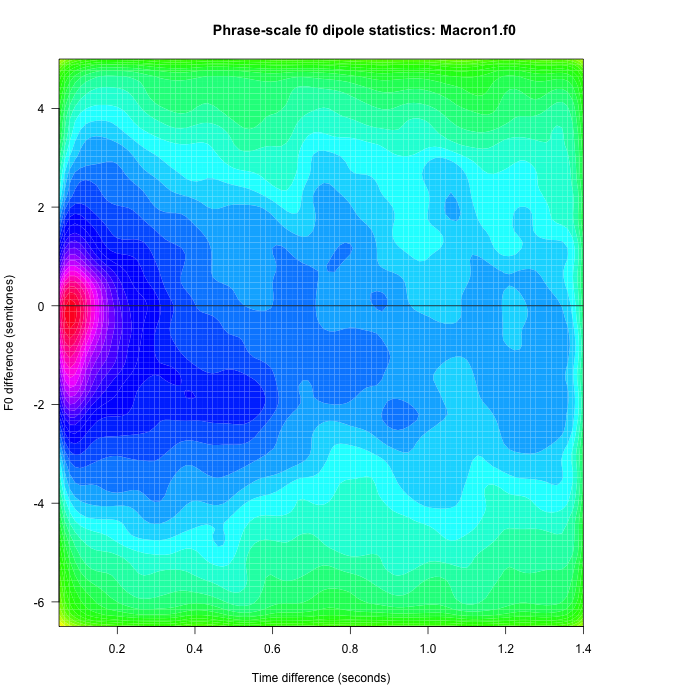
Macron's first answer:
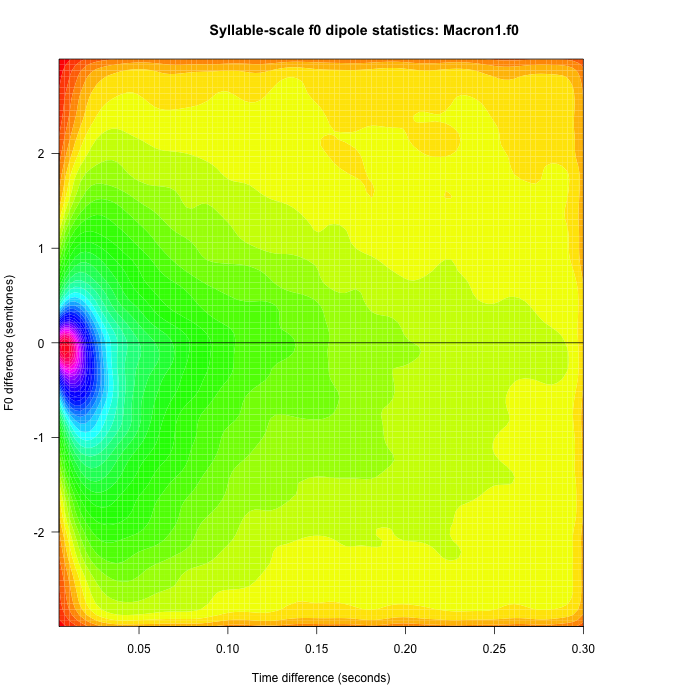
The corresponding syllable-scale and phrase-scale dipole plots:
 |
 |
And the (syllable-scale) plot of delta f0 and delta amplitude:
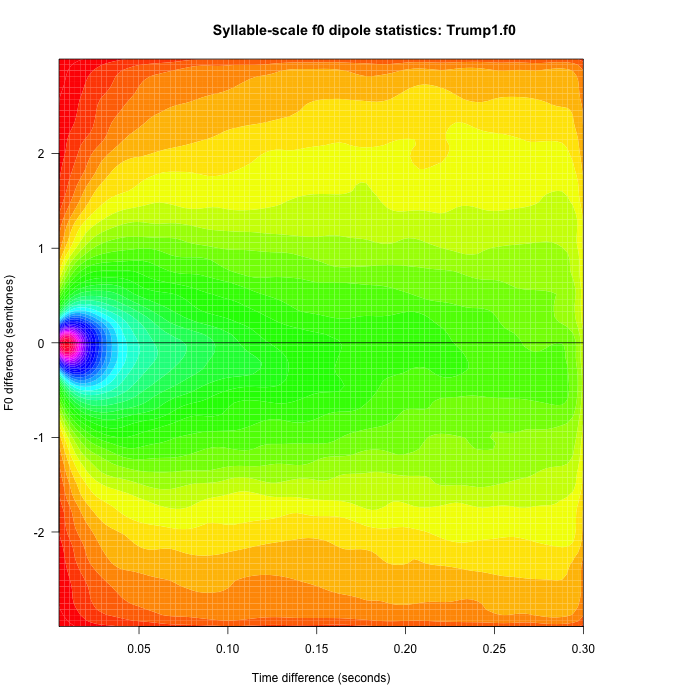
Trump's first answer:
The corresponding syllable-scale and phrase-scale dipole plots:
 |
 |
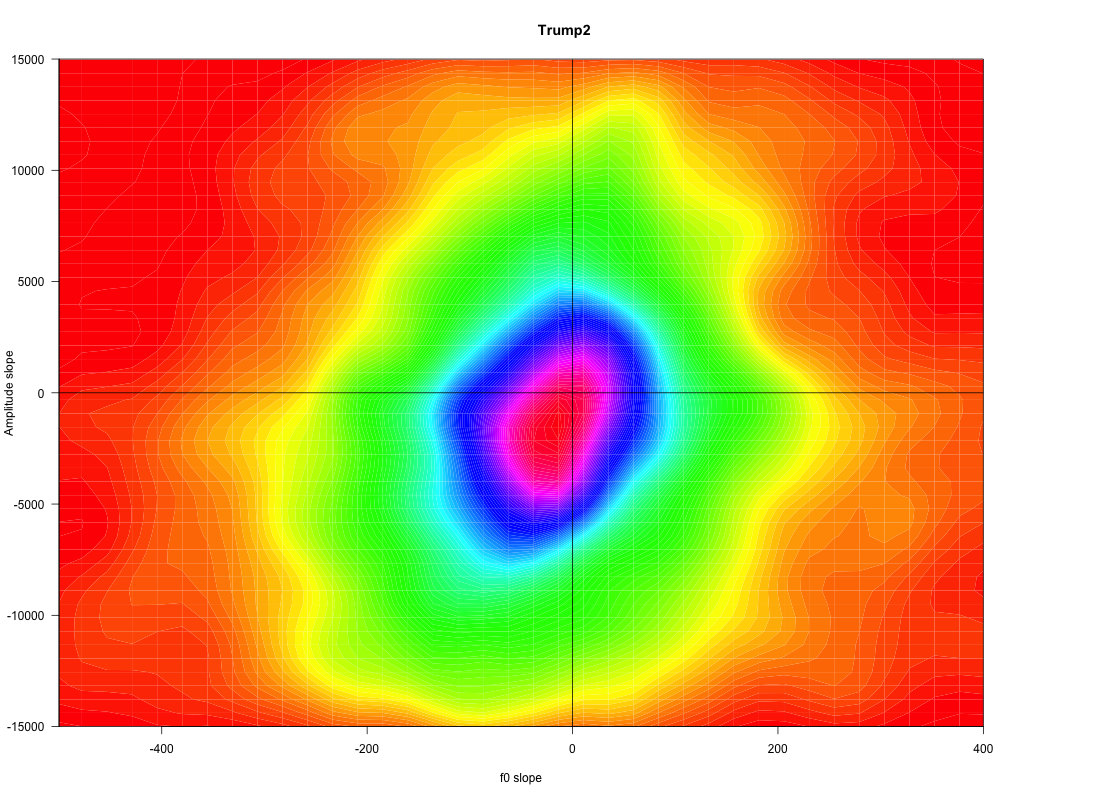
And the (syllable-scale) plot of delta f0 and delta amplitude:
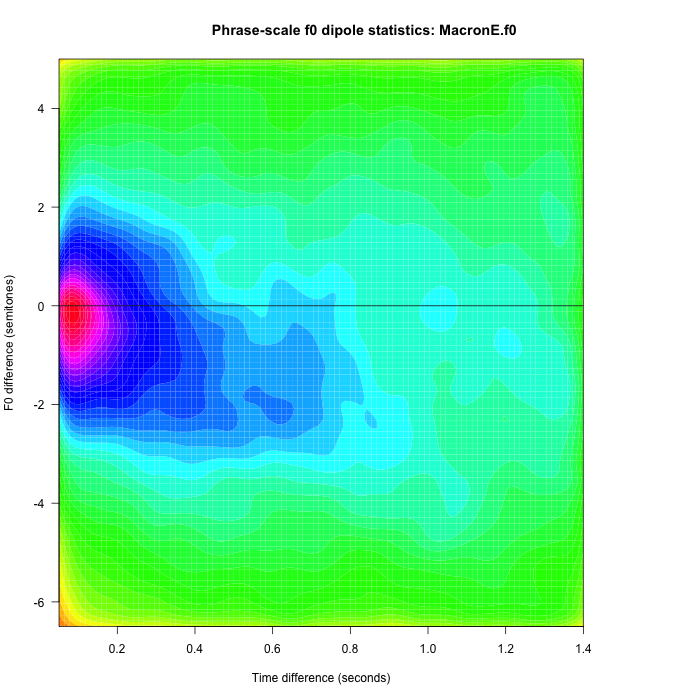
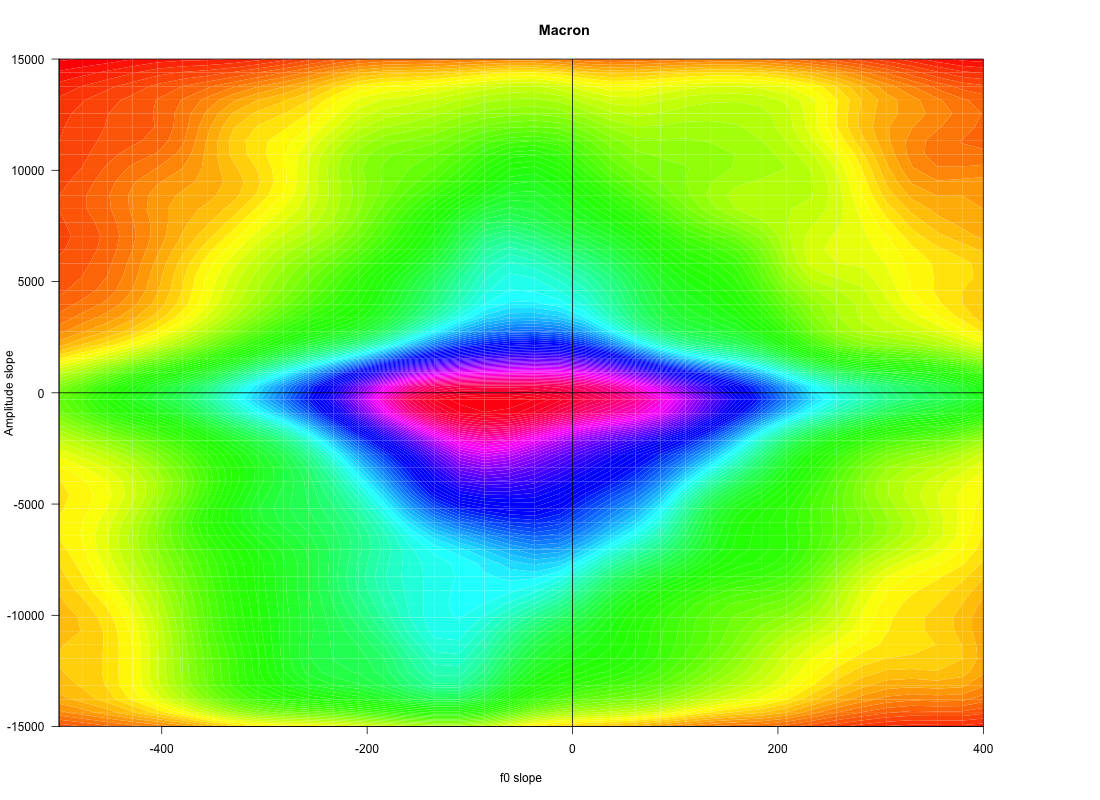
Macron's English response in an exchange about the schedule:
The corresponding syllable-scale and phrase-scale dipole plots:
 |
 |
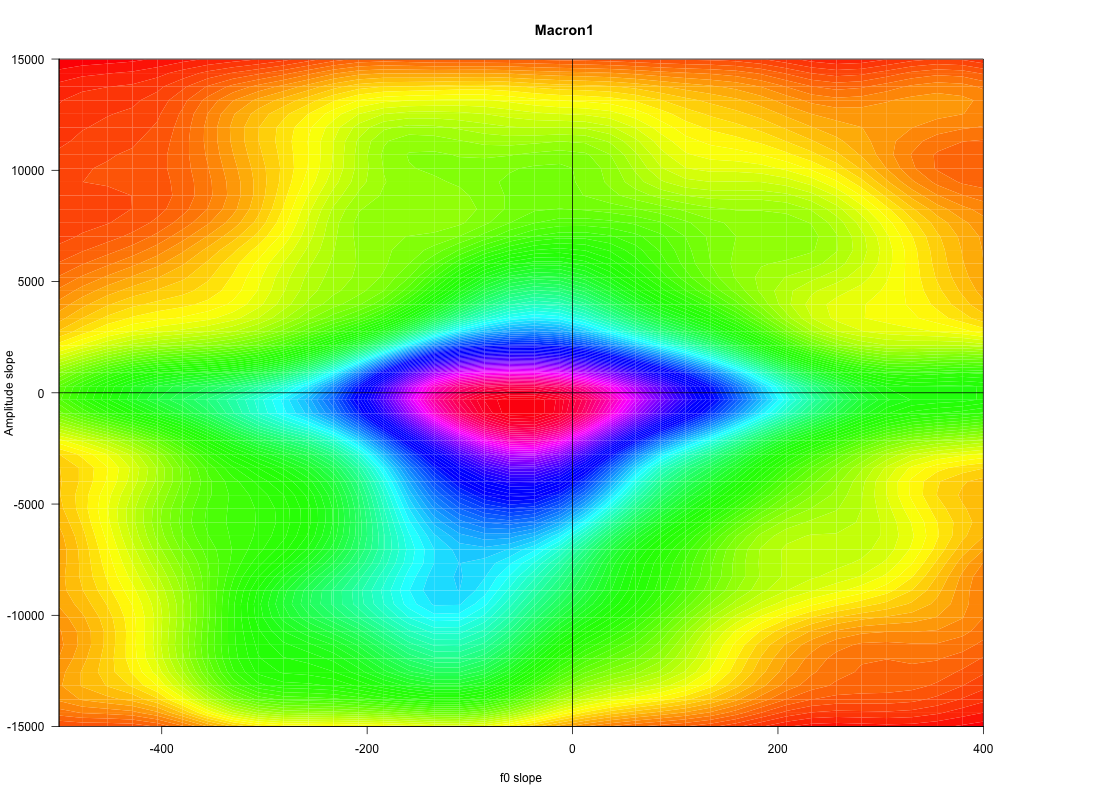
And the (syllable-scale) plot of delta f0 and delta amplitude:
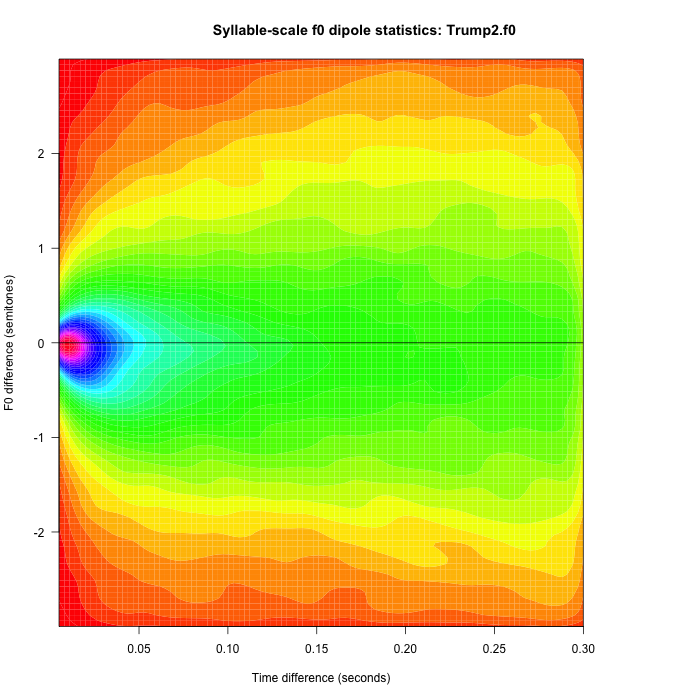
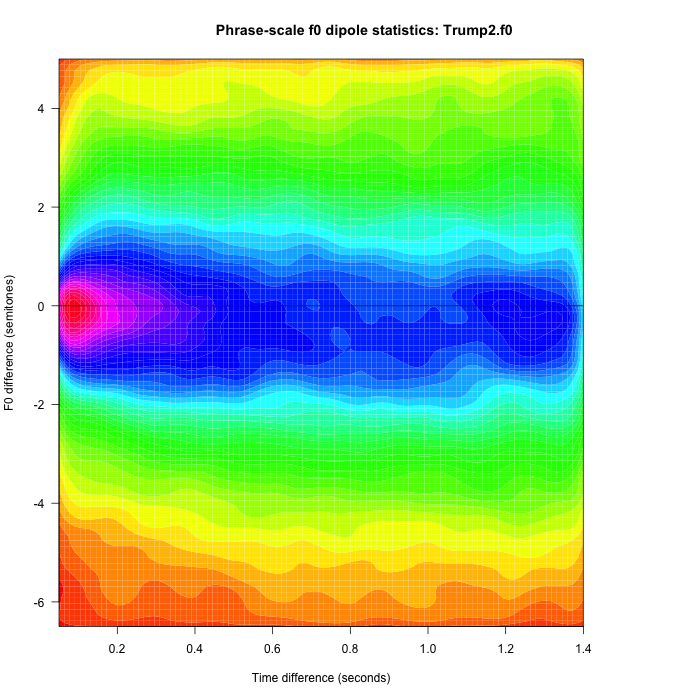
At that point, Macron bowed out. Trump's second answer:
The corresponding syllable-scale and phrase-scale dipole plots:
 |
 |
And the (syllable-scale) plot of delta f0 and delta amplitude:
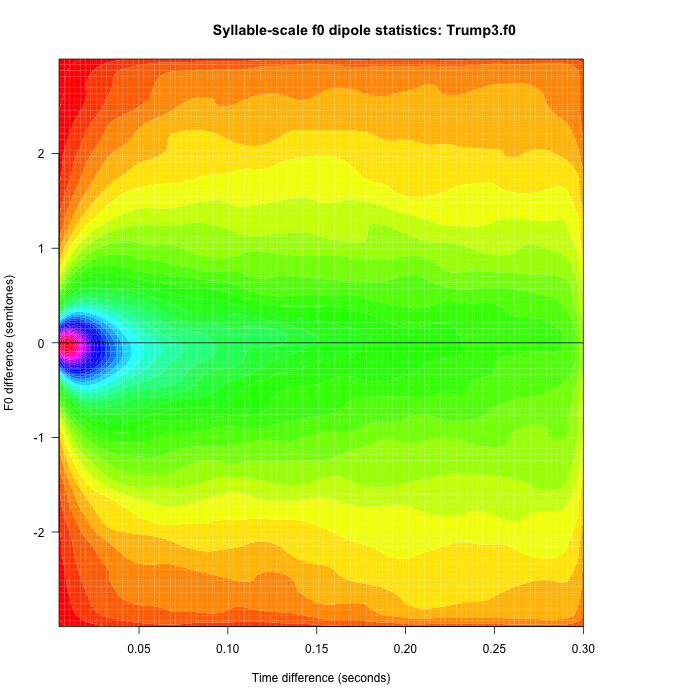
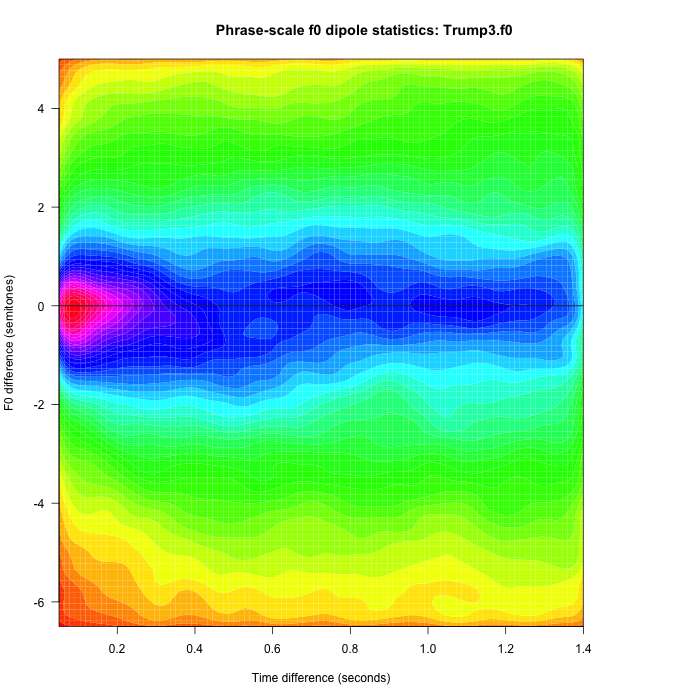
Trump's third answer:
The corresponding syllable-scale and phrase-scale dipole plots:
 |
 |
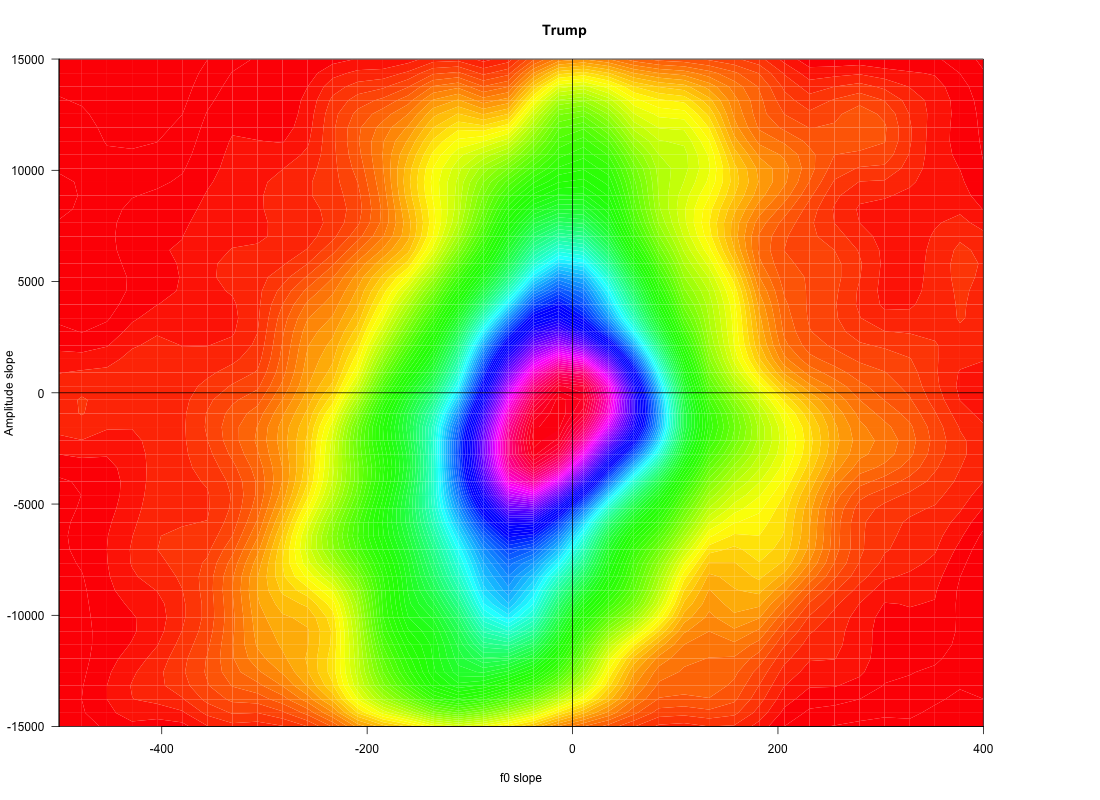
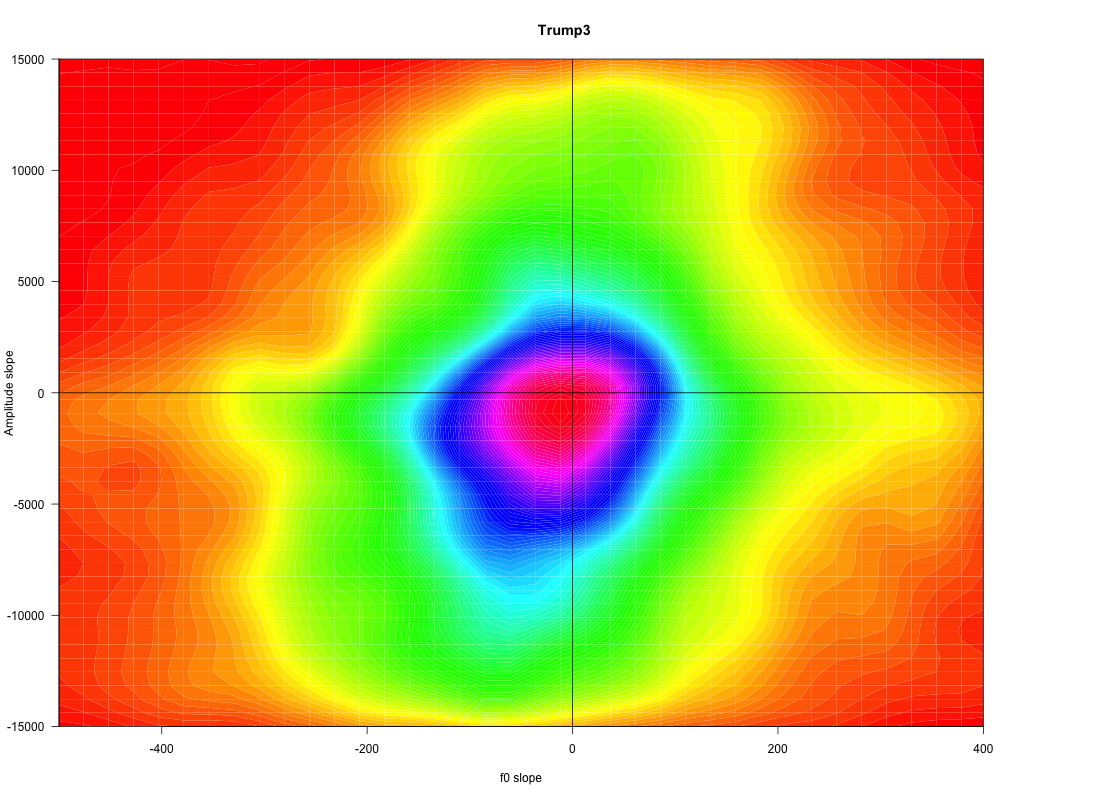
And the (syllable-scale) plot of delta f0 and delta amplitude:
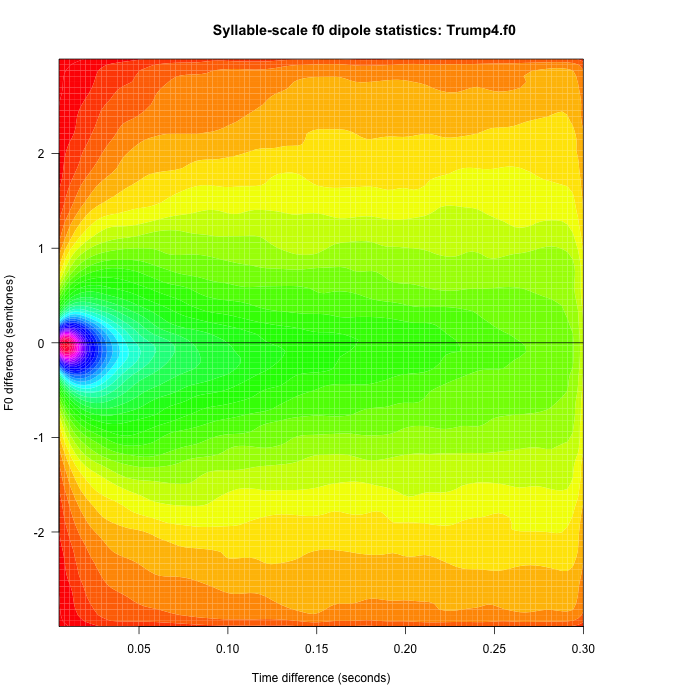
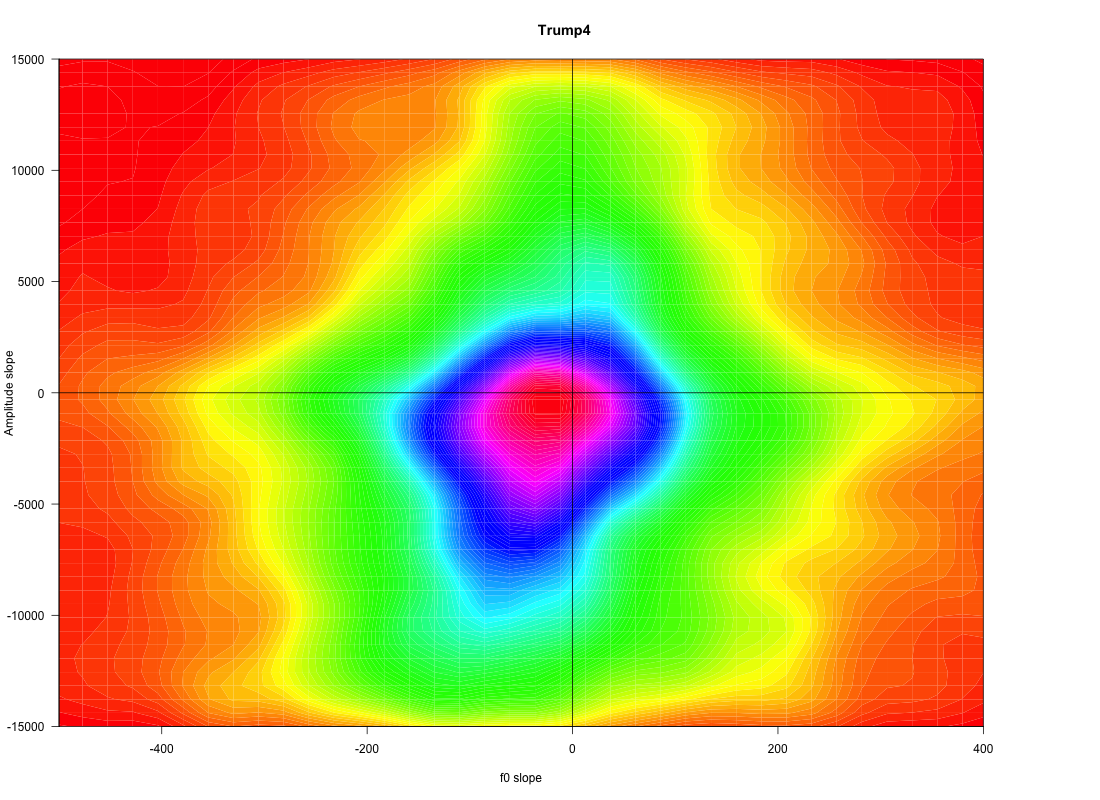
Trump's fourth answer:
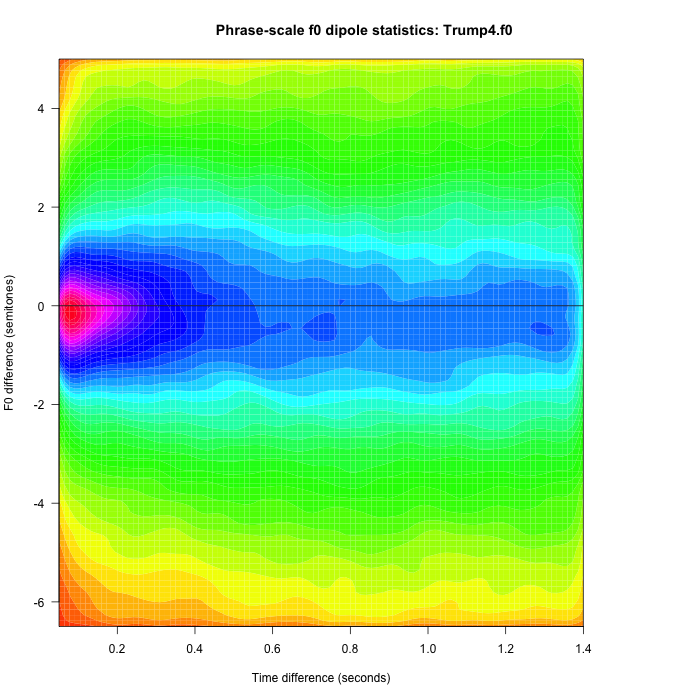
The corresponding syllable-scale and phrase-scale dipole plots:
 |
 |
And the (syllable-scale) plot of delta f0 and delta amplitude:
There's more, but I'll spare us.
And I'll leave exegesis and commentary to the commenters.
For those who want more exact details of what I did, the R scripts for generating the 2D plots are here, and the source code for the pitch tracker I used is here.
Jerry Packard said,
August 31, 2019 @ 12:57 pm
Jerry Friedman said,
August 31, 2019 @ 4:20 pm
Si Macron répondait
In a bilingual way,
One could study how to speak
Avec la prosodie macaronique.
Bob Ladd said,
September 4, 2019 @ 1:35 pm
MYL: Any chance of some discussion of what all these pictures might mean in terms that appeal to our auditory intuitions? Like: Trump's syllable-scale delta-F0 plots have a circle, and Macron's have a vaguely sinister smile shape: what is that likely to have sounded like? Or: Macron's phrase-scale F0 dipole plots are mostly blue and green, while Trump's have a lot of red at the top and bottom edges: is this about their voice (e.g. pitch range) or their prosody (e.g. linguistically meaningful pitch contour choices)? And for all of these, an obvious question: if we were comparing, say, Jacques Chirac with George W. Bush, would we find similar differences? In other words, is this about French and English, or Macron and Trump?