Some speech style dimensions
« previous post | next post »
Earlier this year, I observed that there seem to be some interesting differences among individuals and styles of speech in the distribution of speech segment and silence segment durations — see e.g. "Sound and silence" (2/12/2013), "Political sound and silence" (2/8/2016) and "Poetic sound and silence" (2/12/2016).
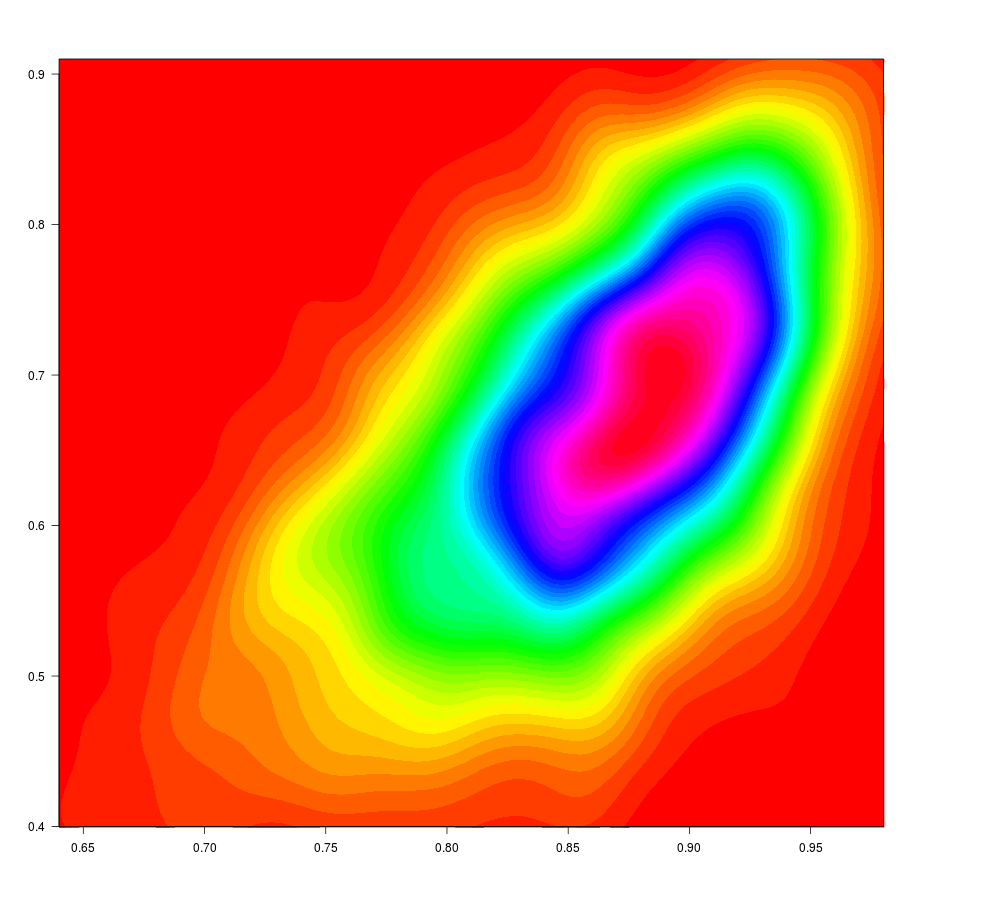
So Neville Ryant and I decided to try to look at the question in a more systematic way. In particular, we took the opportunity to compare the many individuals in the LibriSpeech dataset, which consists of 5,832 English-language audiobook chapters read by 2,484 speakers, with a total audio duration of nearly 1,600 hours. This dataset was selected by some researchers at JHU from the larger LibriVox audiobook collection, which as a whole now comprises more than 50,000 hours of read English-language text. Material from the nearly 2,500 LibriSpeech readers gives us a background distribution against which to compare other examples of both read and spontaneous speech, yielding plots like the one below:

[If you're not puzzled by that plot, you should be — but all will be explained below.]
The earlier posts were based on the output of a Speech Activity Detector (SAD). The advantage of a SAD-based approach is that no transcript is required, and we can even use material in an unknown language. One disadvantage is that it's hard for the program to decide accurately whether short silences are stop gaps or silent pauses, as discussed in one of the earlier posts. So for this exploration, we decided to perform forced alignment between the audio and the corresponding text, which enables us to classify short silences accurately, and to use silent pauses to make an accurate division into speech and silence segments.
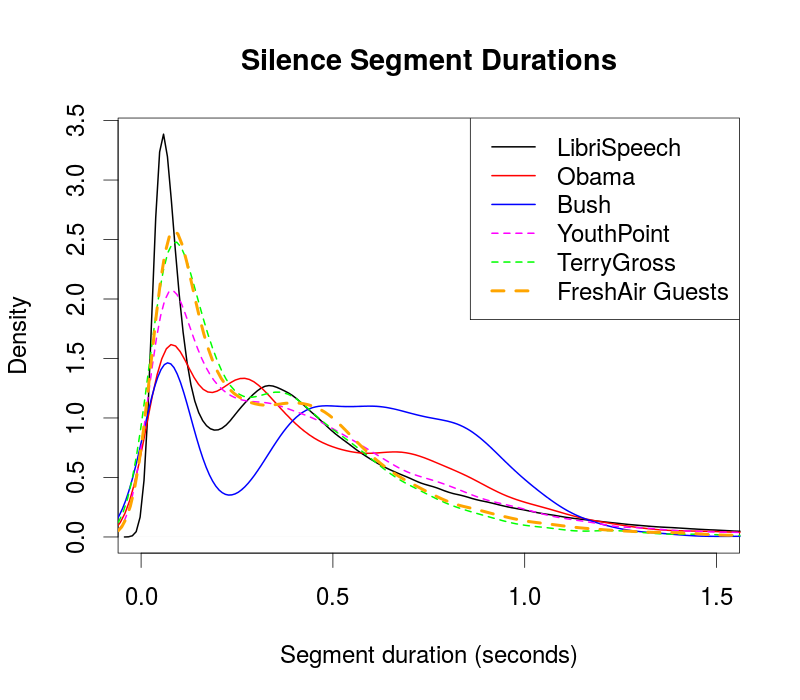
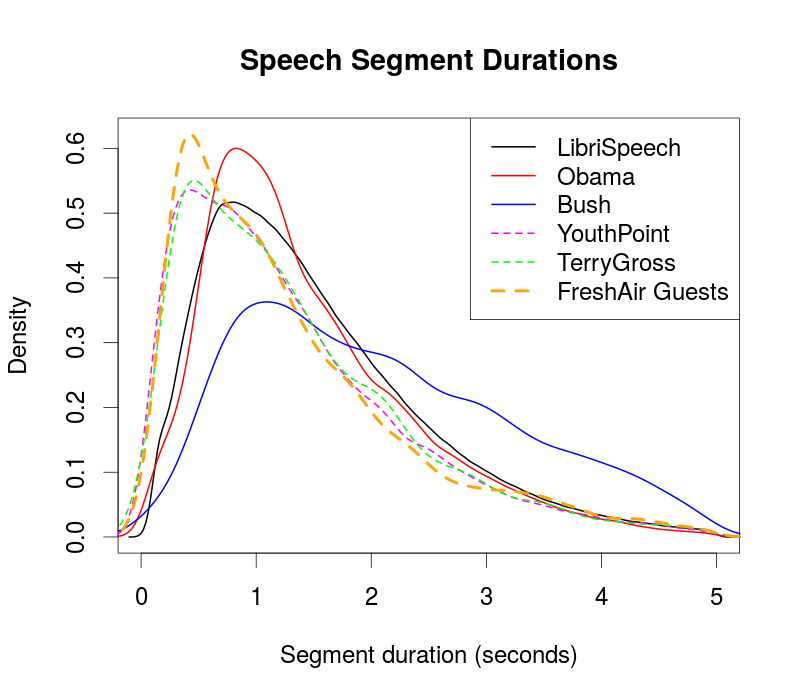
The LibriSpeech datasets comes with alignments supplied by its compilers, but we realigned everything in order to be able to make an appropriate comparison with other data sources. The result was about two million segments of each type, with overall duration distributions as shown in the density plots below:
 |
 |
But those are the distributions of speech and silence durations for all 2,484 readers — how should we characterize the distribution of individual readers' characteristics? The best way to do that would be to fit an appropriate statistical model, and look at the distribution of model parameters.
The speech-segment plot look like the same sort of gamma distribution discussed earlier. The silence-segment plot is clearly bimodal, with the minimum between the two modes at about 200 milliseconds. So the obvious way to characterize individual readers is in terms of a mixture of gamma distributions.
But there are lots of ways to carry this program out in detail, and the interpretation of the resulting parameters in each case may be a little opaque. So we decided to start with a cheap trick, namely to characterize each reader in terms of the proportion of their silence segments that are greater than 0.2 seconds, and the proportion of their speech segments that are greater than 0.6 seconds. The result looks like this, expressed as a 2D contour plot with the speech-segment proportion on the x axis and the silence segment proportion on the y axis:

So we have a distribution, but is it a useful or interesting one?
Let's add to the mix the speech and silence segment durations from some other sources:
Fresh Air: Fourteen radio interviews, involving public figures ranging from Lena Dunham to Stephen King to Gloria Steinem, from National Public Radio’s Fresh Air program. Recordings and transcripts were downloaded from NPR's website, and the transcripts were “dis-edited” to include disfluencies and to correct other transcription errors. The host Terry Gross is treated separately from the interviewees.
YouthPoint: YouthPoint was a radio program produced by students at the University of Pennsylvania in the late 1970s, comprising interviews with opinion leaders of the era. The broadcast versions, are all 30 minutes in duration though the original interviews may be much longer. Our data set includes a subset of 50 sessions with 57 interviewees, including Ann Landers, Mario Andretti, Francesco Scavullo, Mark Hamill, Annie Potts, Chuck Norris, Buckminster Fuller, Erica Jong, Chaim Potok, Isaac Asimov, Ed Muskie and Joe Biden.
Political speeches: 50 weekly radio addresses given by George W. Bush during 2008, and 127 weekly addresses and prepared statements given by Barak Obama between 2009 and 2011. The official transcripts were again "dis-edited" to conform with the audio. Bush and Obama are treated separately.
If we plot the speech segment and silence segment distributions for these sources in comparison to the overall LibriSpeech distributions, we see not only some individual differences, but a suggestion that the read-speech sources (LibriSpeech, Obama, and Bush) are different from the spontaneous-speech sources (YouthPoint, Terry Gross, FreshAir guests):
 |
 |
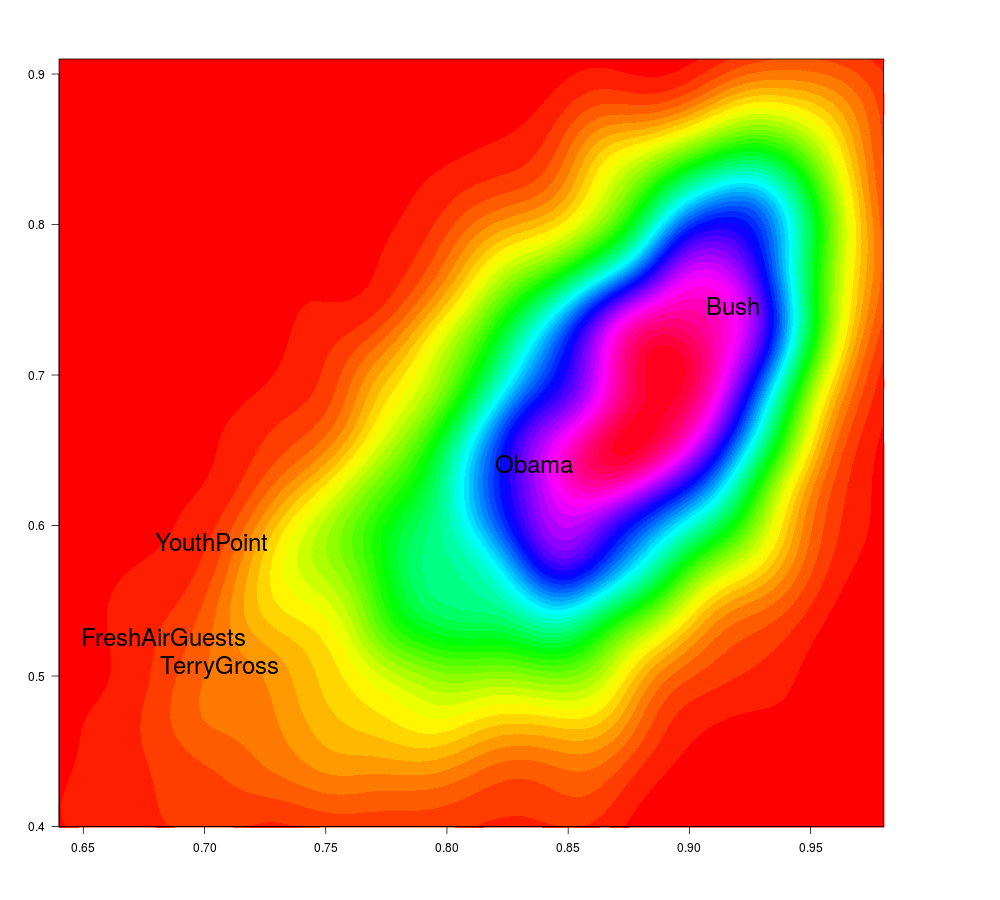
And if we add the other sources to the 2D distribution shown earlier, we get a sensible result:
Bush and Obama are quite different from one another, but both are near the modal region of the 2,484 LibriSpeech readers.
In contrast, the three spontaneous-speech sources are relatively close to one another, and almost completely outside the read-speech region.
And the quantitative difference between the spontaneous and read-speech sources makes qualitative sense. There are presumably fewer long speech segments in spontaneous speech because the compositional process requires additional pauses for thought. And there are presumably fewer long silence segments in the radio interviews because radio hates dead air, so that interviewers (or editors) are likely to intervene if a silent pause goes on too long.
My guess is that unedited conversations, in different cultural and interactional settings, would show a wider range of silence-segment distributions. And the distribution of both speech and silence segment durations will obviously also be a function of the fluency, topic knowledge, inhibition, and arousal of the speakers.
For a more formal report on this research, see Neville Ryant and Mark Liberman, "Automatic Analysis of Phonetic Speech Style Dimensions", InterSpeech 2016.
Thomas Shaw said,
June 30, 2016 @ 9:01 pm
I'd be curious about the statistics for the Ira Glass style public radio commentators. They have a very distinctive (and annoying) speech pattern.