Betting on the poor boy: Whorf strikes back
« previous post | next post »
According to The Economist, 4/2/2009, "Neuroscience and social deprivation: I am just a poor boy though my story's seldom told":
THAT the children of the poor underachieve in later life, and thus remain poor themselves, is one of the enduring problems of society. Sociologists have studied and described it. Socialists have tried to abolish it by dictatorship and central planning. Liberals have preferred democracy and opportunity. But nobody has truly understood what causes it. Until, perhaps, now.
The crucial breakthrough was made three years ago, when Martha Farah of the University of Pennsylvania showed that the working memories of children who have been raised in poverty have smaller capacities than those of middle-class children. [emphasis added]
OK, keep that bold-faced statement in mind. Now let me offer you a bet. Suppose we have a large group of "children who have been raised in poverty", and another large group of "middle-class children", taken from the same groups described in the cited research; and we measure the capacity of their working memories, using the same testing techniques as the cited research. We pick one of the "children raised in poverty" at random, and one of the "middle-class children" at random. Will you bet me that the rich kid will outscore the poor kid, giving odds of, oh, say, 2-to-1? (That is, you put up \$200 and I put up \$100.)
You might not like to gamble on single events — I certainly don't — so let's give you the benefit of the law of large numbers. We'll run this same bet 100 times, with 100 different random pairs of kids. Will you take the challenge now?
It certainly seems like you should — if "the working memories of children who have been raised in poverty have smaller capacities than those of middle-class children" is a statement about all poor kids and all rich kids, then this ought to be a quick way for you to pick up \$10,000, right?
But if you're a sensible person, then your response will be that you have no idea from the Economist article whether I'm offering you a sure thing, a fair bet, or a probable loss. And I have an advantage over you, which is that I know the details of the research that the Economist is talking about.
The reference is Martha J. Farah et al., "Childhood poverty: Specific associations with neurocognitive development", Brain Research 1110(1):166–174, 2006. Martha and her colleagues gave a range of tests to middle SES and low SES African-American girls between the ages of 10 and 13. As I pointed out in a blog post a couple of years ago ("Cultural specificity and universal values", 12/22/2006), the biggest effect found in this important study was actually in in language-related cognitive measures — an effect size of about d=0.95 for vocabulary and sentence-understanding tests:
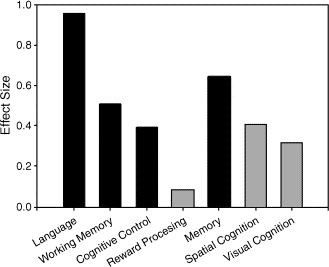
The second-biggest effect, of about d=0.65, was for what they called "the Medial temporal/Memory composite", which involved "incidental learning tasks" (I think that this involved the unattended background of another task.) The Economist's article focuses on what Farah et al. call "the Lateral prefrontal/Working memory composite" — a combination of a spatial working-memory task (something like "where in that array of numbers was the 3?") and a two-back task ("press the button when the stimulus is the same as the one before the previous one") — which had an effect size of about 0.5.
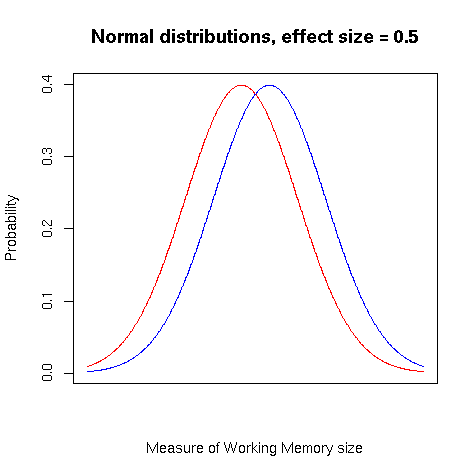
What does an "effect size of 0.5" mean about the distribution of performance among the middle and low SES subjects? This means that the average value for the first group was about half a standard deviation higher than the average value for the second group. If the distribution of values within each group was "normal" (i.e. gaussian), then idealized forms of the two probability density functions would look like this:
(For an example of what empirical distributions look like in such comparisons, see this blog post.)
Another way to think about such overlapping distributions is to ask how often a randomly-selected member of one group would outscore a randomly-selected member of the other group. In this case, we'd expect the random middle-SES girl to do better on a working memory task than a low-SES girl about 64 times out of 100. This is a moderately large effect — though not as big as the difference in language-related scores, where the effect size of 0.95 means that we'd expect the middle-SES girl to have a higher score about 75% of the time.
From this information, you could make an informed guess as to whether I'm offering you a fair bet or not. (The answer is "not" — I'd expect to walk away with more than $800 of your money.)
This is not to say that Martha Farah's discovery about working memory was not meaningful and important. (It's probably less important than her discovery about linguistic abilities, but that's another matter.) Nevertheless, there's a serious point behind the foolishness about betting odds. Generic statements like "the working memories of children who have been raised in poverty have smaller capacities than those of middle-class children" seem to be general statements about the properties of groups, but in fact they're not. Rather, they're statements about the distribution of properties of the individuals making up the groups. And they're effectively meaningless if they don't tell us anything about how much the distributions overlap.
Whenever you see a statement of this kind, you should ask yourself "at what odds would I take a bet on the outcome of a series of random paired comparisons?" Or some related statement, like "how often would a randomly-selected member of group A beat a randomly-selected member of group B?", or "what is the effect size?" or "how do the quantiles compare?" In this particular case, the comparison was not only statistically significant, it involved a moderate effect size — but nothing about the Economist's description could give you any confidence in that outcome. It might have been a statistically-significant difference in group means with an effect size of 0.05, and I might have walked away with piles of your money at odds of 5-to-4 or less.
OK, let's go on with the article from The Economist:
Since Dr Farah’s discovery, Gary Evans and Michelle Schamberg of Cornell University have studied the phenomenon in more detail [and] have found that the reduced capacity of the memories of the poor is almost certainly the result of stress affecting the way that childish brains develop. […]
To measure the amount of stress an individual had suffered over the course of his life, the two researchers used an index known as allostatic load. This is a combination of the values of six variables: diastolic and systolic blood pressure; the concentrations of three stress-related hormones; and the body-mass index, a measure of obesity. For all six, a higher value indicates a more stressful life; and for all six, the values were higher, on average, in poor children than in those who were middle class. Moreover, because Dr Evans’s wider study had followed the participants from birth, the two researchers were able to estimate what proportion of each child’s life had been spent in poverty. That more precise figure, too, was correlated with the allostatic load.
The capacity of a 17-year-old’s working memory was also correlated with allostatic load. Those who had spent their whole lives in poverty could hold an average of 8.5 items in their memory at any time. Those brought up in a middle-class family could manage 9.4, and those whose economic and social experiences had been mixed were in the middle. [emphasis added]
Now it's betting time again. We're going to compare random pairs of poor and middle-class youths from population in this study, using the same working-memory test they used. I'm going to bet on the poor kids. At what odds will you take my bet?
This time, you should know enough to keep your wallet in your pants or purse until you get some more information. The cited paper (Gary W. Evans and Michell A. Schamberg, "Childhood poverty, chronic stress, and working memory", PNAS early edition, 3/30/2009) is Open Access, so you all can read it. Unfortunately, it doesn't really give us the information we need to set odds, at least not in an easy-to-assimilate form. But from this graph, you can get a sense of how it's going to turn out:

The difference in the group averages was 0.9 items. From the scatterplot, I'm guessing that the standard deviations were substantially greater than 1.8, so the effect size was less than the 0.5 that Farah et al. found; and as a result, I'm going to be happy to take your money at 2-to-1 odds. If I spent a bit of time toting up values from the graph and doing some simple calculations, I might be happy to lower the odds considerably and still be confident of coming out ahead.
More seriously, let's think about how the Economist's writer expressed this result. At least we're given some numbers, not just a generic statement that one group scores better than the other. But the only numbers that we get are the mean values for each group, without any way to judge what this means in terms of the degree of overlap of the distributions. And as a result, the numbers are almost meaningless, at least with respect to the issue that the article wants to address, namely "how poverty passes from generation to generation". (We might also want to know how well measures of working memory predict socio-economic outcomes; but never mind that for now.)
I'm not criticizing the research, which is an important contribution. (Martha Farah, in particular, is a good friend as well as a terrific researcher). Nor am I criticizing the Economist, exactly — it's not only the best magazine in the world these days, it's actually quite good. But on this particular point, the Economist is rarely any better than its peers.
This is presumably because a significant proportion of its readers would be baffled by talk of effect sizes or percentiles, while the proportion who are bothered by vague talk about generic differences is minuscule. Such things are not effectively taught or widely learned, even among quantitatively-minded intellectuals. But I also think that there's a linguistic aspect. If Benjamin Lee Whorf were alive, he might argue that our whole society is intellectually hamstrung by the way that English — like all the other languages of the world — tends to make us think about the evaluation and comparison of the properties of members of groups. And, I think, he might be right.
The easy and natural ways of talking about group comparisons express differences in terms of properties of the groups involved, or in terms of properties of imaginary generic or average group members: "the working memories of children who have been raised in poverty have smaller capacities than those of middle-class children"; "Those who had spent their whole lives in poverty could hold an average of 8.5 items in their memory at any time. Those brought up in a middle-class family could manage 9.4". Writers and speakers may know what's really going on, at least with half of their brains, but readers and listeners are fooled into thinking that they understand these generic statements, even though in the absence of information about the comparison of distributions rather than the comparison of average values, they're left completely unable to put that understanding to any valid use.
This situation ought to be just as puzzling, at least to members of a more advanced civilization, as the Pirahã's ignorance of numbers is to us.
Rubrick said,
April 5, 2009 @ 4:54 pm
I think your approach provides as close to a solution as we can get: the natural language in which to express these things without invoking technicalities most readers won't understand is the language of gambling. Unfortunately, few writers adopt this approach.
[(myl) And the popularity of slot machines and roulette games suggests that relatively few readers understand the language of gambling, anyhow. ]
(Off-topic, a cute little conundrum I came up with years ago: If someone approaches you and insists that you are, right at this moment, actually asleep and dreaming, and is willing to bet this is the case, at what odds should you accept the "No, I'm awake" side of the bet? The question seems to be "What is my confidence level that I'm actually awake right now?", but there's a funny little catch.)
[(myl) Does the catch have to do with the fungibility of dream dollars? ]
Sean said,
April 5, 2009 @ 5:42 pm
Rubrick, I'd always take the bet — there's no financial risk to losing.
peter said,
April 5, 2009 @ 6:04 pm
Rubrick said: "the natural language in which to express these things without invoking technicalities most readers won't understand is the language of gambling"
Well, "natural" only (a) if you don't have a world-view which precludes chance events (as is the case, for example, for predeterminists, such as Isaac Newton) and (b) if you don't have any ethical or religious objections to gambling. Supporters of Bayesianism, for example, like to proclaim their theory of uncertainty as being objective, when in fact its operationalization in the form of gambles encodes a particular modernist, western cosmology.
D.O. said,
April 5, 2009 @ 7:49 pm
I think the analogy with Pirahã is a good one. The main reason is just that, we are not much interested. Speaking from personal impression, why would I care about differences in memory capacity of AA girls between ages 10 and 13? What about larger population? What about connection between memory capacity and progress in life? Are there any differences before 10 or after 13? And on, and on, and… When Larry Summers invoked a more complicated concept – same mean, different variances – it was reported quite well because, I guess, a lot of people took an offence. And no numbers were needed.
Given that the very conclusion "poverty perpetuates through poorer memory" is such a far cry from the actual study, who would be interested in any numbers at all?
joseph palmer said,
April 5, 2009 @ 8:16 pm
There is no hope for improvement if in order to make sense of such articles we all need to be statistical experts or invent a new language. I'm not sure that is the case – anybody can see that unless we know to what degree there is a difference then the information given above in the initial Economist paragraph is not worthy of note. Given more information and a critical attitude then we can also do a lot with it without resorting to serious math. My skills with statistics are fairly poor, and yet I am at least, like anyone I would think, able to read the later information and shrug without the expert analysis provided. The differences seem fairly meagre, the causes seem fairly unclear.
I think the reason that journalists usually get away with sensationalizing this sort of material is that many people are reluctant to engage in any way with difficult-seeming, "scientific" research, and making it seem even more difficult isn't going to help.
Carl Zimmer said,
April 5, 2009 @ 10:20 pm
Mark: As a science writer, I believe that our collective work would be much improved if we had to take statistics courses. Unfortunately, at least in the United States, it's a bit of a side-track from the standard geometry-algebra-trig-calculus pathway.
I also think it's great for you to point out how wrong we can get if we fall prey to a kind of group-essentialism. I recently used it as an example of what good comes out of blogging on science (http://blogs.discovermagazine.com/loom/2009/03/25/visions-of-the-crash/).
But when I got to the conclusion, I was surprised at your fatalistic tone. Instead of showing us how we might revise these passages so that they would be suitable for popular publications *and* be closer to the real data, you end by suggesting that we are hamstrung by English itself.
(I'm imagining my next call with my editor: "I know it's as clear as mud, but that's just English itself. What can you do? Have you read Whorf, by any chance?")
If there really is no way to make this stuff any clearer, I see only two honorable options.
1) Science writers should not write about such studies because we can't–even though a study like this you consider valuable.
2) Continue to write about this research in with our essentialist fallacies, content in the knowledge that nobody–not even a linguist–can do better.
Is there any chance you might play the part of the rewrite desk?
Mark F. said,
April 5, 2009 @ 11:39 pm
It would help if there were an agreed-upon vocabulary for translating effect sizes into words. With earthquakes, I think they've settled on a different adjective for each integer increment in earthquake magnitude. You could do something similar with effect sizes — say
<2.0 – substantially …
>3.0 – much
In addition, always say "on average", even if you think that's understood.
This choice of adverbs conflates the size of the difference in practical terms with the size of the difference relative to the standard deviation, but for most studies about group differences in humans, I think terms could be chosen to convey the right sense. For a 2-SD difference to be small in a practical sense, you'd have to have a pair of pretty homogeneous populations.
I can see lots of problems with this idea, but the competition is "A's are X-er than B's".
[(myl) In fact, Jacob Cohen, the inventor of "Cohen's d", the effect-size measure based on dividing the difference between the means by the pooled standard deviation, rather hesitantly suggested such a scale:
See these lecture notes for more discussion, and in particular these other passages citing some of Cohen's other ideas (from his book Statistical power analysis for the behavioral sciences) for communicating effect sizes:
One caveat is that this all applies only to distributions that are "normal", i.e. gaussian. Real-life distributions often are not, and in such cases a blind interpretation of estimated standard deviations could lead you astray. ]
[The above comment had a whole range of adverbs ranging from "marginally" through "appreciably" before getting up to "much". But a less-than sign got interpreted as html and I didn't check the preview carefully enough before posting, and the adverbs were destroyed… Sorry about that.]
Peter Seibel said,
April 6, 2009 @ 12:58 am
I may simply be revealing my own innumeracy — if so forgive me. But if I'm understanding this properly, mightn't a good way to explain these kinds of numbers be in terms of the expected number of people in various percentiles (or deciles) in a population. For example given that "poor" kids can remember an average of 8.5 items and "rich" kids, 9.4 and assuming normal distribution and a standard deviation of 1.8 then can't we say, we'd expect that in a population of, say, 20,000 kids, equally divided between rich and poor that the top tenth would be populated by something like 1,417 rich kids and 583 poor kids. (Sorry, I got those numbers by creating a simulated population rather than by calculating the probabilities directly; c.f. my aforementioned innumeracy.) Conversely, the bottom tenth would be something like 548 rich kids and 1,452 poor kids. Or maybe it's better expressed as a percentage: the top tenth of the population would be 70% populated by rich kids while the bottom tenth would be 23% rich.
Either way, I'd guess that non-statistically savvy readers, might be better able to wrap their heads around the idea that there will be more rich kids in the top tenth but still some "lucky" poor kids who are just as capable (according to this measure) as the best rich kids than understanding when or when not to take a bet at what odds in order to maximize their expected value over a series of bets.
This same kind of explanation would also work well, I think, for the same mean, different standard deviation between groups scenario, where the group with more variance would be found more often in the top and bottom groups and less often in the middle.
Anyway, a thought.
Garrett Wollman said,
April 6, 2009 @ 2:14 am
I would like to suggest that the near-universal difficulty in expressing these sorts of results in natural language, despite the clear and obvious interpretation when presented as a diagram or as a graph of the idealized distribution, suggests an entirely sensible conclusion: natural language is the wrong tool for the job — at least for a sighted audience. Our visual systems are astonishingly good at not distinguishing things that differ by only a little. The right question for a science writer to ask could well be, "What would Tufte do?"
Sometimes a picture really is worth a thousand words.
David said,
April 6, 2009 @ 2:17 am
I was going to write a dismissive comment but the more I think about, the more convinced I am.
I'm more comfortable with probabilities than odds, but either giving the probability that a random A:er is better than a random B:er, or the odds of a "fair" game, does seem to be a much more intuitive way of conveying the information. It would also make it less likely that the statistically illiterate or intellectually lazy misunderstand the statement.
peter said,
April 6, 2009 @ 3:31 am
Further to my comment above contesting that gambling provides a universal framework for talking about uncertainty, another person to whom talk about chance events was alien was Albert Einstein, like Isaac Newton (but for different reasons), a predeterminist.
The other Mark P said,
April 6, 2009 @ 4:04 am
I would have thought the original result showed quite convincingly that there must be more to it than working memory.
Few rich kids end up at the very bottom end of society (and those that do can often be attributed to specific causes, like a fondness for drugs, that have little to do with memory). Few poor kids end up at the top.
Yet the distributions show a much more mixed effect.
Now could memory be a proxy for something else? Like, say, the inherited component of intelligence. Best not to go there though.
Personally I think the poor children end up disadvantaged because their parents don't have enough money.
Sili said,
April 6, 2009 @ 5:31 am
Personally, I think that your 'sampling' language works quite well.
It seems to me to give a better impression of the uncertainties involved when you say "If you select 100 As and 100 Bs at random and test them one-on-one, you'd expect the As to 'win' in 54 cases."
acilius said,
April 6, 2009 @ 8:17 am
Fascinating post, and quite convincing.
I must admit, however, that I hope you're wrong about one thing. I subscribed to THE ECONOMIST for 14 years and still read it from time to time. If it is "the best magazine in the world these days," we're all in serious trouble. Every article dealing with a topic of which I had direct personal knowledge fell somewhere on a range from the grossly misleading to the completely unreal.
Mark Liberman said,
April 6, 2009 @ 8:41 am
Carl Zimmer: But when I got to the conclusion, I was surprised at your fatalistic tone. Instead of showing us how we might revise these passages so that they would be suitable for popular publications *and* be closer to the real data, you end by suggesting that we are hamstrung by English itself.
I did suggest ways that comparison of distributions can be made more accessible — the expected outcome of competitions between random pairs, for example. Well-designed graphs can also be effective. But in the end, I think that it's hard to overcome the desire to tell a compelling story, in primary colors instead of pastels, reinforced by the essentializing tendencies of natural languages.
This particular case is an especially difficult one, I think, because the effects are genuinely meaningful as well as merely statistically significant. (Perhaps it would help to coin a phrase like "sociologically significant", on the model of "clinically significant"…) So the goal is not to debunk the research, but just to express its content accurately.
Mark Liberman said,
April 6, 2009 @ 8:46 am
Carl Zimmer: If there really is no way to make this stuff any clearer, I see only two honorable options.
1) Science writers should not write about such studies because we can't–even though a study like this you consider valuable.
2) Continue to write about this research in with our essentialist fallacies, content in the knowledge that nobody–not even a linguist–can do better.
Let me put it this way: in writing about such things for the general public, you'd like to be brief, clear, and correct. However, in the current state of public knowledge, you can achieve any two of those goals, but not all three.
Kate G said,
April 6, 2009 @ 8:57 am
The post starts by discussing whether or not it's possible to get out of poverty. When I look at that bubble graph (Proprtion of Life in Childhood Poverty as the X axis) what strikes me is that almost all the bubbles are at 1.0 and 0.0. There are hardly any in between. That, far more than the Y position of any of the bubbles, seems to answer the question. According to their retrospective measures, you're either poor or you're not. Hardly any of their subjects wandered in and out of poverty over their childhoods.
[(myl) I'm afraid that you've mistaken a design feature of their experimental sample for a property of the world at large.]
bianca steele said,
April 6, 2009 @ 10:23 am
You rarely see dynamic analyses attached to these kinds of studies, I think. In a single-elimination game, in which each round pitted a rich kid against a poor kid, after two rounds, with an effect size of 0.95, given Mark Liberman's analysis above, the expected number of poor kids left standing would be 6.25. (Assume two thirds of the rich kids who pass each round would not have to play another.) After three rounds, the expected number of poor kids would be less than two. That's the case even with a tiny difference in the means of the two populations. However, in a game that paired contestants randomly (and forced rich kids to play more rounds), you would expect more poor kids to be left standing at the end — I don't have the statistics knowledge to calculate the result in this case. If we saw results comparable to this, though, we'd have to posit some causal mechanism for the non-random behavior of the system. That would be difficult. But it would be more honest than saying that a tiny difference in ability makes a huge difference in real-world performance (as would indeed be the case if the game situation were more fair).
Mark Liberman said,
April 6, 2009 @ 10:26 am
There's another complicated discussion to be had about the relationship between measures of cognitive abilities and socio-economic outcomes. The literature on this question is enormous, and I don't know it very well. But this passage from Ceci & Williams, "Schooling, Intelligence & income", makes sense to me:
The reference is to William Dickens et al., "Does the Bell Curve Ring True?", The Brookings Review, 13(6): 18-23 (Summer, 1995). Again, I'm not trying to argue against the importance of the cognitive factors identified by Farah et al. and by Evans et al. — for example, such factors might not explain much about why people are rich, but they might have a greater effect on why people are poor. In any case, there's a set of econometric issues here, not just psychological ones.
Mark F. said,
April 6, 2009 @ 10:47 am
Another bit of prescriptivism that might help is to avoid the adverb "significantly" when you mean that the difference is statistically significant. Usually you can just say that researchers found there was a difference; by default that should mean that the finding was statistically significant. And when "significant" is used (in the newspapers) in a technical sense, it should always be preceded by "statistically" (or "clinically" if that's what's meant). Even though I should know better, I can't read something like "Girls were found to be significantly better at distinguishing the two pitches than boys" without first thinking that "significantly" means "substantially."
Rubrick said,
April 6, 2009 @ 1:48 pm
For those responding to my comment about the language of gambling: I don't think whether one has a predeterministic worldview has any relevance here. If I flip a coin, betting $1000 on heads at any worse than even odds is foolish whether you believe the outcome is truly undeterimined or that the future is frozen in time.
Mr Punch said,
April 6, 2009 @ 2:04 pm
Here's another complication: Look at the graph of normal distributions, and note that the two bell curves are not the same shape — they converge more than they "should" at the extremes. If the curves were merely offset, even by a little bit, that would mean the ratios of the two groups would be very different at the extremes compared to the middle. This is a big issue, because a lot of the real-world implications of such research have to do with the extremes. This is in a sense the same problem as the "broader bell curve" matter that got Larry Summers (but not Malcolm Gladwell) into such trouble.
[(myl) I'm not sure what you mean; but in fact the two gaussians in the picture have identical standard deviations, and differ only in their mean values. Summers' argument was indeed based on the idea that the distribution of certain abilities for males might have a larger standard deviation than the distribution for females, so that even if the means are the same, there would an excess of men at both low and high extremes. But no one is making an argument of that form in this case, and the graph certainly does not illustrate it.]
Marc w/ a c said,
April 6, 2009 @ 3:48 pm
Regarding the study and the Ceci & Williams study as well, isn't this a little too reliant on the design of the IQ and working memory tests themsevles? As I understand it, the IQ test is *designed* to yield a Gaussian distribution of intelligence (or: the abilities the IQ test is testing), but this seems one step too removed from the real-life application of these skills. e.g. What is the incremental benefit to being able to remember 7 numbers in my head instead of 6 and how does that compare to 5? Or, in other terms, what is the benefit in my ability to accomplish some life-relevant higher order task if I'm 1 vs. 2 SD above the mean in WM/IQ? If Ceci and Williams did the statistics using this potentially non-continuous function would IQ matter more?
njkayaker said,
April 6, 2009 @ 7:31 pm
The simple rule is that the average value of a population is a poor predictor of the value that any individual holds. Put another way, the average is a property of a population not of an individual. Confusion about this often underlies racist comments.
peter said,
April 7, 2009 @ 7:40 am
njkayaker said: "The simple rule is that the average value of a population is a poor predictor of the value that any individual holds. Put another way, the average is a property of a population not of an individual."
This is one reason why so-called evidence-based medicine fails to dominate clinical medical practice. A clinician is always faced with a particular individual, with that individual's specific medical history, proclivities and attributes, while the published research evidence is always about populations and sub-populations, and never about that individual.
vanya said,
April 7, 2009 @ 12:42 pm
I agree with Acilius – if The Economist is "the best magazine in the world" these are sad times indeed. I've had the same experience – on topics that I know well The Economist often seems to be shallow or misleading. And indeed most Americans would probably be shocked to know how young and inexperienced many of the journalists writing for The Economist are. It's a useful magazine certainly – as a digest of current events and topics – but I wouldn't even call it quite good.
bread & roses said,
April 7, 2009 @ 7:33 pm
As I recall, the effect in working memory only showed up when the researchers controlled for other factors- race, health, gender, schooling opportunities,- all those things that play into socioeconomic success, and they limited the cultural scope somewhat (in studying only African-American girls). In fact, they probably were quite limited geographically, also. That's why they concluded that childhood stress was a statistically significant culprit in inheritance of poverty, and not racial discrimination, lack of access to good schools, cultural expectations, lack of wealth- all those things a person might think would have an effect. But out in the real world, those factors are not controlled for, and are unevenly distributed between the poor and the middle class. So what I might write, given what I know of the study, is:
If everything else is equal (which it never is), when looking at a group of children that is artificially divided into two categories, poor and middle-class, (rather than being distributed along a continuum), the poor children will have slightly poorer memories, to an extent that can be teased out by statistics, but that you wouldn't notice in person. That might be one more reason why, in the world where nothing else is equal, poor children tend to have less socioeconomic success than their middle-class peers.
It seems to me that no magazine would print that, because it's boring. The study is interesting to sociologists. But that doesn't mean that its results are actually interesting to non-sociologists. I fully support the effort of the press to keep the public informed of current scientific findings. But the unfortunately, most of current scientific research makes tiny little contributions to theoretical structures that are already in place. So the Economist could accurately, briefly, and clearly say "Sociologists complete study that clarifies another minor factor to add to all of the major, well-understood factors in why poverty continues through generations."
Steve Sailer said,
April 8, 2009 @ 10:30 pm
Considering that America's most prominent man of science, James D. Watson, got his career kicked to the curb for expressing himself clearly, is it any wonder that people express themselves in a muddy fashion on these kind of topics?
For example, look at Carl Zimmer, a NYT contributor's comment:
"2) Continue to write about this research in with our essentialist fallacies, content in the knowledge that nobody–not even a linguist–can do better."
I don't even know what that means, other than the jargon term "essentialist fallacies" shouts "Please don't Watson me! I'm a true believer."
[(myl) If you don't know what Carl meant, you must not have read the post that he's commenting on. So let me explain it again.
We start from the observation that people often use generic expressions of the form "Xs are P-er than Ys" to refer to a situation where the mean value for P among Xs is somewhat higher than the mean value for P among Ys, such that a randomly selected X has (say) a 51% (or 53% or 64% or 79%) chance of being higher in P than a randomly selected Y. The "essentialist fallacy" is to take the generic expression to describe a fact about the essence of Xs as a group and Ys as a group, which leads a reader to the natural (but by hypothesis invalid) inference that (almost) any X is more P than (almost) any Y. When such relationships are used in public policy decisions (or in medical decisions or any other situation where we want to make inferences from group membership to individual characteristics), it's really important to know whether we're talking about a 51% chance of X being bigger, or an 80% chance, or a 99% chance. But the usual language of science reporting doesn't give us a clue about this.
Some people have philosophical objections to making decisions about individuals based on group membership. But the question of whether such objections are appropriate or not is not really relevant here; and James Watson's famous remarks about race and intelligence are doubly or triply irrelevant, since that controversy involved many questions of fact about his specific claims, and many other moral and political questions about his specific suggestions.
The problem here is that the statistical illiteracy of the public, combined with the lack of convenient ordinary-language expressions for comparing distributions between groups, makes things difficult for science writers. The way I put it is that you can have any two out of the three goals of clarity, brevity, and accuracy. And this applies whether you're talking about the effects of childhood stress on adult short-term memory, as in the case discussion in this post, or the effects of fetal testosterone on adult ability to read faces, or whatever. It's got nothing to do with political correctness. ]
Nigel Greenwood said,
April 9, 2009 @ 1:32 pm
@ Garrett Wollman Our visual systems are astonishingly good at not distinguishing things that differ by only a little. The right question for a science writer to ask could well be, "What would Tufte do?"
Excellent point. (See this article to learn more about Tufte.) myl's graphical illustration of the two distributions is fine as far as it goes; but I can't help feeling that another chart — which I haven't got the software to produce just now, but which should be pretty simple for him to generate — would make the point more clearly. Underlying his 64/36 split between randomly-selected middle- & low-SES girls' performance on a working memory task is the basic statistical result that, for independent random variables, the variance of a difference is the sum of the variances. Without this knowledge, there's no simple way to jump from the 2 overlapping distributions to the answer to his original question.
The Tufte approach would, I suggest, be to show a distribution centred on 0.5 & with std dev sq root 2, entitled Differences in Memory Task Scores (randomly-selected pairs). The larger part of this distribution (to the right of the y-axis) could be labelled "Middle-SES girl outscores low-SES girl"; & conversely the smaller part to the left (where the difference is negative) could be labelled "Low-SES girl outscores middle-SES girl". I'm sure that with a little thought the labels could be improved to make the point more succinctly.
Linda F said,
April 10, 2009 @ 7:58 am
Keep in mind that those individuals studied are just that – individuals. I was raised in poverty, yet currently hold a technical Master's degree, and am a highly qualified Physics & Chemistry teacher.
Projecting outcomes with only one factor is not a good teaching strategy.
Nigel Greenwood said,
April 10, 2009 @ 10:28 am
Re Tufte approach: What about the following labels:
Chart title: Who wins on Memory Task?
Subtitle: (pairs chosen at random)
Distribution labels: Rich girl wins/Poor girl wins
2009-04-10 Spike activity | Psychology Blog said,
April 10, 2009 @ 6:35 pm
[…] the effects of poverty on brain development was published by Economist. You must read an excellent follow-up by Language Log showing all is not what it […]
acilius said,
April 11, 2009 @ 10:24 pm
@Vanya: You make a very good point. THE ECONOMIST is largely written by people under the age of 25.
Moreover, they tend to work on very short deadlines and to be subject to editors whose departments are so expansive that they can't possibly have any kind of expertise in more than a tiny fraction of what crosses their desks. It's really surprising that the magazine (do they still call themselves a "newspaper"?) is as good as it is.
rosy said,
April 14, 2009 @ 2:13 pm
I think one of the problems with scientific, and other "numerate discipline" writing for a "general interest" audience is a reluctance to exploit the fact that a picture tells a thousand words with anything other than emotive photos. That diagram with the overlapping bell curve is a perfect case in point – totally intuitive, no need to understand difficult maths because it's there in front of you. It's probably to some extent a publishing hang-over from the days when it was technically difficult, and expensive, to get a diagram into the print media, but that's no longer true. If there were even quite a small set of commonly used conventions about what sort of diagram you might use to illustrate what sort of statistics I think you'd get a big improvement in understanding. Plus, you can't fudge a diagram. A journalist against a deadline is going to be presented with the temptation to write up something he or she hasn't had time to understand properly…
Charlotte said,
April 17, 2009 @ 9:50 pm
Apologies for commenting on a pretty dead thread. As a maths graduate I'm probably not the best person to say what's comprehensible to the avarage reader, but I'd agree that the charts are a lot more concise than trying to put it into words.
Having had a quick look at the study, I'm not sure what 'allostatic load' really measures, and I'm a little surprised no-one else has mentioned it. It gives binary outcomes for the variables, and at the very least the blood pressure/BMI are going to be pretty highly correlated. I don't have access to the articles referenced, but they all seem to have the same person as 1st/last author, which increases my scepticism. Any thoughts?
Open Lab selections 2009 « Seeds Aside said,
January 13, 2010 @ 5:49 am
[…] Betting on the poor boy: whorf strikes back by the Language Log. […]
Announcing the posts that will be published in The Open Laboratory 2009! [A Blog Around The Clock] « The Swarm said,
January 13, 2010 @ 6:44 pm
[…] from Cognitive Daily. Why swine flu is resistance to adamantane drugs by the Scientific Activist. Betting on the poor boy: whorf strikes back by the Language Log. A sorry saga, the crumbling cookie from the Mr. Science Show. The rightful […]
Best science writing from the blogosphere | Yooxe said,
March 17, 2010 @ 9:41 am
[…] Betting on the Poor Boy—a great article by Mark Liberman, Ph.D., analyzing an Economist story about the way the stresses of poverty impact brain development. Liberman takes a typical news-article paraphrasing of study data—Group X is more likely to do something than Group Y—and explains why you have to look more sharply at the numbers to get the real story, and why linguistics is just as important as statistics. This is something I'll definitely be keeping in mind as I work. […]
Stats, Poverty, and Not So Smartness « upiu.org said,
March 18, 2010 @ 12:03 pm
[…] Betting on the poor boy: Whorf strikes back […]
Interesting elsewhere – 22 March 2010 | Public Strategist said,
March 22, 2010 @ 1:13 pm
[…] Language Log » Betting on the poor boy: Whorf strikes back […]