How to turn one out of five into three out of four
« previous post | next post »
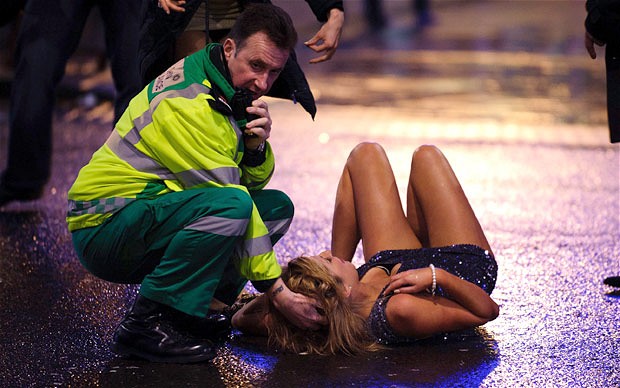
 Towards the end of last year, there was a bit of a fuss in the UK about the role of alcohol in hospital costs. Thus Sarah Knapton, "Three in four people in A&E at weekend are there because of alcohol: 70 per cent of people are admitted to emergency units at the weekend as a result of drinking", The Telegraph 12/21/2015 — illustrated with the rather atypical picture on the right.
And there was plenty of other coverage, e.g. "Alcohol-related A&E cases rise to 70% of workload at weekends", Daily Mail 12/21/2015; Mike Doran, "Alcohol responsible for up to 70% of all A&E admissions as experts renew minimum unit price calls", The Mirror 12/21/2015; Annalee Newitz, "Drunk people account for 70% of weekend emergency room visits in UK city: Drinking binges are now a scientifically measurable phenomenon", Ars Technica 12/22/2015.
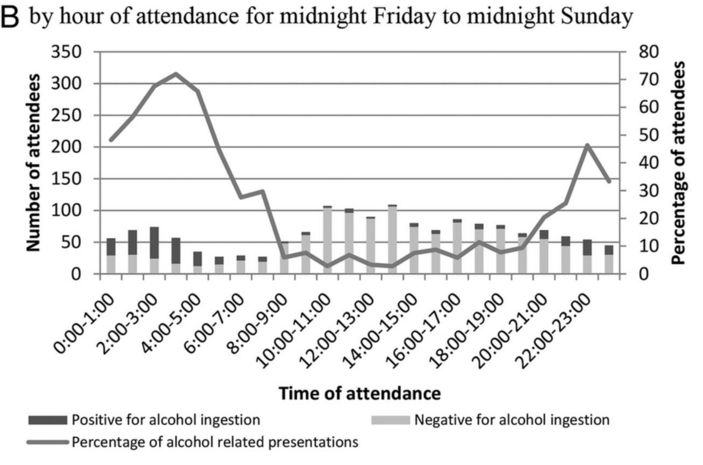
But there's just one little wrinkle: the actual rates that the study found (of alcohol involvement in weekend emergency-room visits) were more like 20%. So how did the journalists get from "one in five" to "three in four"? Well, basically in the same way that we're allowed to conclude that in 1986, the rate of space-shuttle explosions was one per week. After all, there was one week in that year (the last week of January) when there was an explosion. And in the cited study, there was one weekend hour (2:00-3:00 a.m.) when a bit over 70% of the patients were measured with a non-zero breath alcohol content.
This time, most of blame falls on the scientists, who flat-out fibbed in the discussion section of their paper — though not, or at least not to the same extent, in their data tables. A bit more blame belongs to whoever wrote their press release, "Almost three-quarters of weekend emergency care caseload linked to booze". In this context, the journalists are guilty only (as usual) of failing to read the underlying paper.
To wit: Kathryn Parkinson, Dorothy Newbury-Birch, Angela Phillipson, Paul Hindmarch, Eileen Kaner, Elaine Stamp, Luke Vale, John Wright, Jim Connolly, "Prevalence of alcohol related attendance at an inner city emergency department and its impact: a dual prospective and retrospective cohort study", BMJ 2016.
As they explain:
Data for two cohorts of patients aged 18 years and over were gathered, each for pre-specified equivalent periods in 2010/2011 and 2012/2013 (table 1). Within the relevant calendar years, 1 week per quarter was selected to cover the first, second, third and fourth weeks of the month. Each week of data collection ran from 00:00 on day 1 to 24:00 on day 7.
[…]
Retrospective data (2010/2011): Computer based records (attendance database logs and e-records) and paper based hospital patient records (ED casualty cards and ambulance patient report forms) were screened for ED attendances involving alcohol. All records which included the terms ‘alcohol’, ‘intoxication’ or a type of alcohol consumed by the patient (eg, ‘patient reported drinking cider’) were categorised as alcohol related attendances in the dataset.
[…]
Prospective data (2012/2013): Breath samples were collected from patients to provide a non-invasive and objective measure of alcohol intake. Research nurses and other medical staff (referred to as ‘researchers’ in this article) collected BrAC measurements using a hand held breathalyser (Dräger Alcotest 6810 med).
[…]
Due to the high proportion of negative cases from the BrAC test results from the prospective cohort, the scores were dichotomised into positive (any quantity of alcohol) and negative cases.
[…]
Across the 4 study weeks covered by retrospective data collection, 5121 adult patients presented to the ED, and during the prospective period 6526 adult patients presented (table 1). The overall prevalence rates of alcohol related attendances were 12.4% and 15.2% for the retrospective and prospective samples, respectively (table 2);
In the prospective study, "The mean BrAC reading for all positive cases (n=498) was 0.7 mg/L (SD 0.4)". The mean value is twice the UK legal limit of 350 micrograms per litre. It translates to 0.147% blood alcohol content, if I've done the math right, which is about 1.8 times the usual U.S. limit of 0.08 for DUI. However, the standard deviation of 0.4 means that quite a few of those who tested positive (for any level at all) were below the UK legal definition.
So what actually happened? According to their Table 2,
| DAY | Retrospective | Prospective | ||
| No alcohol | Alcohol | No alcohol | Alcohol | |
| Friday | 648 | 95 | 475 | 97 |
| Saturday | 646 | 136 | 603 | 189 |
| Sunday | 679 | 138 | 665 | 163 |
So in the "prospective data" (based on measurements rather than records search), if we take the "weekend" to be Friday/Saturday/Sunday, we get 449 out of 2192 = 20.5%.
If we take the "weekend" to be Saturday/Sunday, we get 342 out of 1610 = 21.2%.
And remember, that's 20.5-21.2% with any detectable breath alcohol content at all — some fraction of the cases, given the cited standard deviation, must have been well below the level of impairment.
And yet in the authors write:
The overall prevalence rates of alcohol related attendances were 12% and 15% for the retrospective and prospective cohorts, respectively, with high variation according to the time of day and day of the week. On weekend days, over 70% of attendances were alcohol related, and these patients typically presented in the early hours of the morning.
How do they come up with that? Here's their Figure 2B:
No doubt binge drinking is a problem. But the presentation of this study is click-bait, worthy of the Daily Mail. Oh wait — was this one of the famous BMJ Christmas stories? A subtle one, if so…

Jonathan Mayhew said,
January 19, 2016 @ 12:08 pm
Not to mention 70% could be interpreted as "almost three in four" or just a "a little more than two in three" (66.666666…%). Why automatically round up rather than down if not for tendentious effect.
David Fried said,
January 19, 2016 @ 2:00 pm
"All records which included the terms 'alcohol,' " [or] "intoxication" . . . were characterized as alcohol-related attendances." Therefore if the words "patient denied drinking alcohol" or "patient did not appear intoxicated" appeared in the medical record, the record was classified as an "alcohol-related attendance." Really?
[(myl) Probably. Automated analysis of text fields in medical records is a non-trivial problem. Fifteen years ago I worked for a while on the problem of finding indications of heart disease in such records — turns out there are more ways to say "cardiac abnormalities were not observed" than you might think.]
bfwebster said,
January 19, 2016 @ 3:02 pm
I had to take upper-division statistics as a computer science undergrad; a few years later, I took a graduate CS class on pattern recognition, which was largely advanced applied statistics and calculus. The combination left me with an innate skepticism of 'scientific studies' reported in the press (or even published in the literature) because of the myriad problems and issues that usually surface when you start examining how the study/experiment was carried out.
Recently, my former wife (we're still good friends) took an online class in statistics as part of her work towards an MS in Nursing degree. She asked for my help explaining a few concepts, but largely completed it on her own (and got an A). She reads lot of medical research papers, and she said the class gave her an entirely new perspective on many of those.
The Other Mark said,
January 19, 2016 @ 3:03 pm
And remember, that's 20.5-21.2% with any detectable breath alcohol content at all
And it doesn't bother to sort out whether the alcohol had any effect on their admissions. So if I'd had half a bottle of wine, then had a heart attack, it would be classified as "alcohol related".
All this study really does is determine that quite a few people drink in the evening.
David Morris said,
January 19, 2016 @ 5:15 pm
Could they have written "up to 75%", in the same way that shops advertise "up to 75% discount" on their sales? That is, one item is 75% off – the others are anywhere between 5 and 20%
Graeme Andrews said,
January 20, 2016 @ 10:13 am
This paper is discussed in BBC Radio 4 show "More or Less" where one of the authors (Professor Kaner) admits it "could have been worded slightly better".. It is available at http://www.bbc.co.uk/programmes/b06vn925 (about 15 minutes into the show)
J. W. Brewer said,
January 20, 2016 @ 5:15 pm
They've squished the 2-3 am slot for late Friday night (Sat am) and late Saturday night (Sun am) into one datapoint, which raises the question of whether the hourly rate was really above 70% for two hours out of 48 or only one. Although eyeballing the graph, where it looks like those two hours average out to maybe 72% or thereabouts, I guess that if one of the two slots had been below 70% on a freestanding basis the other might have been close to or above 75%, thus incentivizing them to break down the data more finely and make 75% the headline claim?
(The squishing together seems otherwise problematic because while the 2-3 am slot might plausibly be quite similar both nights, you might plausibly expect the incidence of alcohol-related problems in the 10-11 pm slot to be materially less on a Sunday evening than a Saturday evening, so giving merely an average of those two time slots is not very illuminating.)
J. W. Brewer said,
January 20, 2016 @ 5:18 pm
Or, to put it differently, using a 48-hour period starting at say 6 or 7 pm on a Friday rather than at midnight would better capture the rhythm of the "weekend" from an alcohol-consumption standpoint.