Gender, conversation, and significance
« previous post | next post »
As I mentioned last month ("My summer", 6/22/2017), I'm spending six weeks in Pittsburgh at the at the 2017 Jelinek Summer Workshop on Speech and Language Technology (JSALT) , as part of a group whose theme is "Enhancement and Analysis of Conversational Speech".
One of the things that I've been exploring is simple models of who talks when — a sort of Biggish Data reprise of Sacks, Schegloff & Jefferson "A simplest systematics for the organization of turn-taking for conversation", Language 1974. A simple place to start is just the distribution of speech segment durations. And my first explorations of this first issue turned up a case that's relevant to yesterday's discussion of "significance".
In Neville Ryant and Mark Liberman, "Automatic Analysis of Speech Style Dimensions", InterSpeech 2016, we found systematic differences among individuals and contexts.
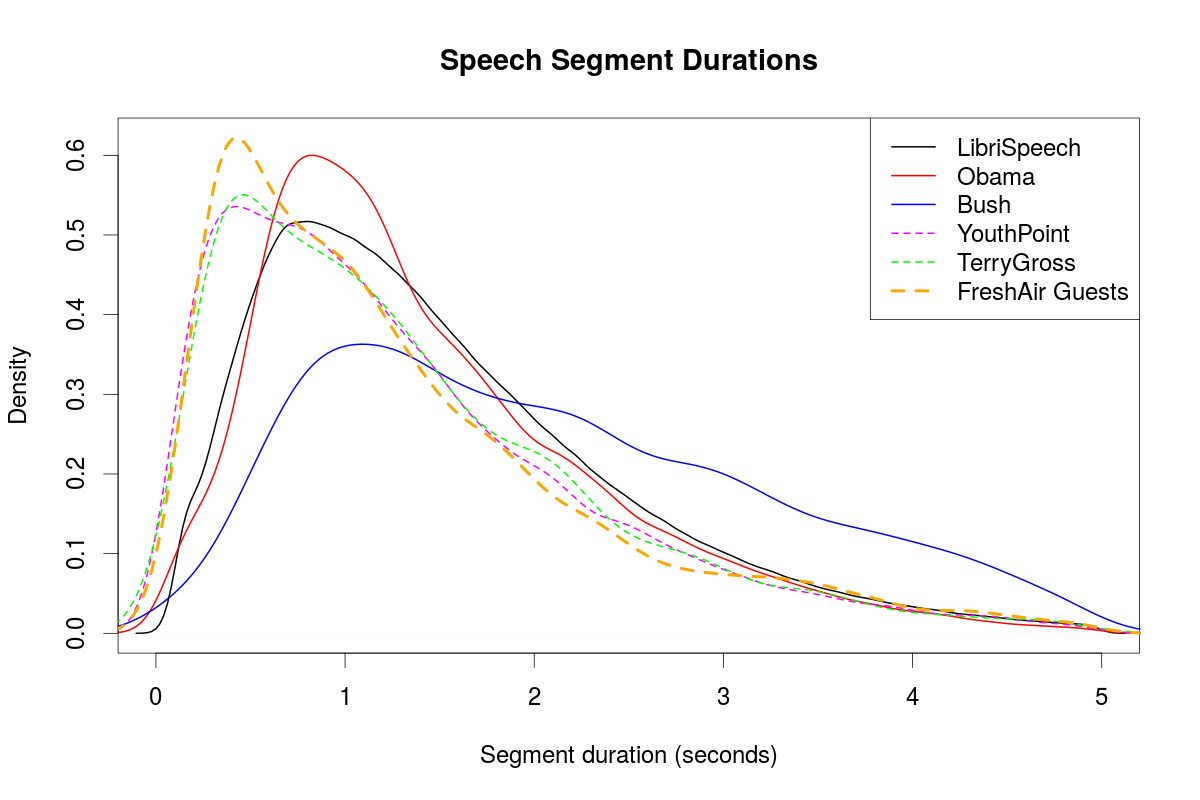
In that paper, we found that speech segments generally tend to be shorter in spontaneous/conversational speech than in fluent reading. The graph below compares density plots for speech-segment duration in three sources of read text and three sources of conversational speech. The largest read collection is LibriSpeech, 1,571 hours of text reading by 2,484 speakers. The distributions for Bush and Obama are from their weekly addresses, about 14 hours in total. From spontaneous/conversational speech, we have 8.5 hours of the interview program Fresh Air, with the data for the guests and the host (Terry Gross) plotted separately; and 14 hours from YouthPoint, a radio program produced by students at the University of Pennsylvania in the late 1970s.
This should not be a surprise — there are several sources of shorter speech segments specific to spontaneous/conversational speech, including backchannels and evaluations ("mm-hmm", "yeah", "right", "I know", "no kidding", "OK", "maybe", …), and pauses that reflect the process of composition, often with repetition or self-correction across the gap.
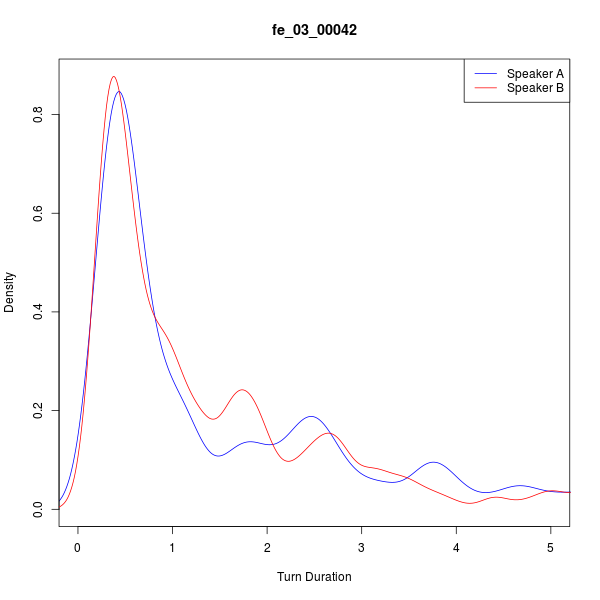
If we look more closely at individual conversations, we see some where the participants' distributions of speech-segment durations are pretty much the same, and others with significant differences. Here are the distributions for two two-party conversations from the Fisher (English) collection:
 |
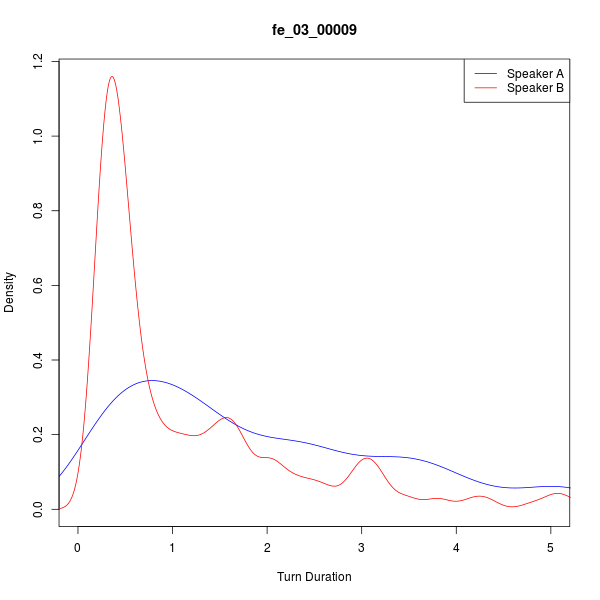 |
In the second case, Speaker A is doing most of the talking: 412.5 seconds in 200 segments, compared with 269.9 seconds in 213 segments for Speaker B.
This reflects an asymmetry in conversational roles — much of the dialogue is like this:
103.70 110.54 A: (( )) here and we have i think it's more healthy too you know the fat and more veggies greens
110.99 111.52 B: yeah
111.65 112.52 B: yes yeah
113.07 115.40 B: certainly more so than like the fast food
116.02 119.18 A: yeah i mean i i gained here uh
119.47 125.98 A: how many like thirty poun- uh pounds or so but then i started on this diet eating
123.29 123.62 B: yeah
126.33 127.96 A: in a at home and
128.39 129.89 A: lost lots of weight even i'm
130.02 130.76 A: thinner than
131.08 132.65 A: than when i came here you know
132.77 133.08 B: yeah
This naturally raises the question of how to quantify such differences, and how to relate them to individual characteristics and social or conversational roles. The Fisher collection is fairly large (23398 conversational sides) and relatively uniform in interactional context (short telephone conversations between strangers on assigned topics). There's no variation in interactional role, and our information about individual characteristics is limited (sex, age, years of education, region), but some of those characteristics are stereotypically related to speech styles.
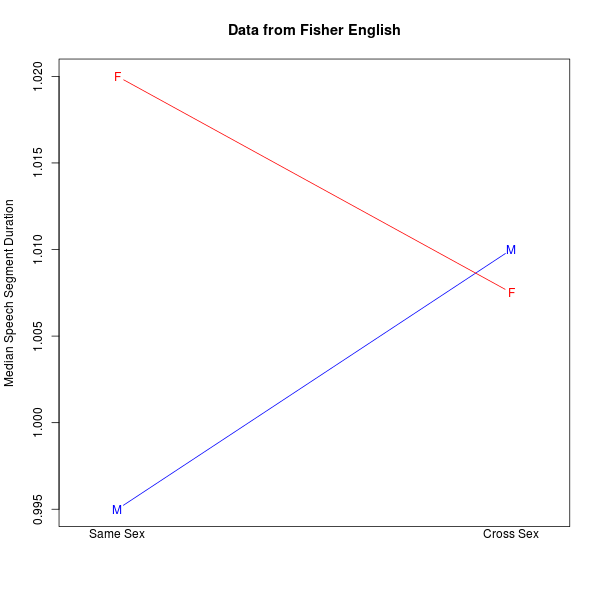
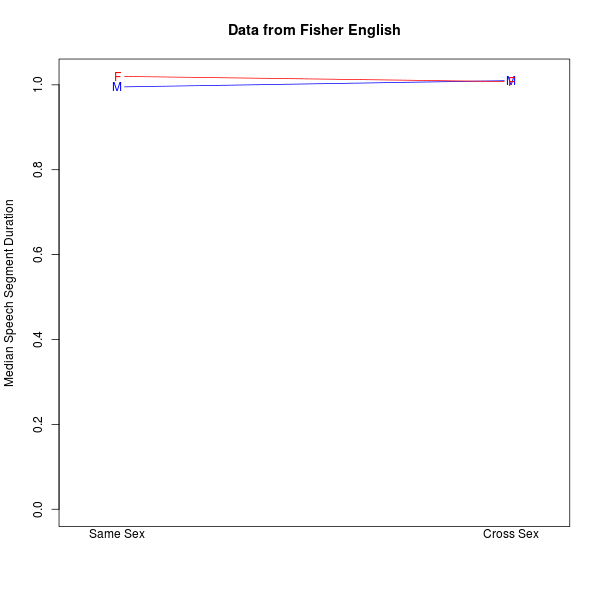
The simplest way to parameterize the distributions of speech-segment durations is just to look at their means or medians. And if we look at the median length of speech segments by sex in the Fisher dataset, we see something interesting.
The mean value of the median speech-segment durations of women talking with women is longer than the comparable value of men talking with men. This difference is highly significant (in statistical terms), p-value = 6.734e-05 according to Welch's t-test, or less than one chance in ten thousand that the difference is due to sampling error. But the speech-segment durations of women talking with men and men talking with women are essentially the same by this measure (p-value = 0.2211):
And the differences between the Same Sex and Cross Sex conditions are also "significant". At this point we could wave our hands at various gender stereotypes and talk about accommodation theory.
But if you've looked at the numbers on the y-axis, you'll realize that this is an excellent object lesson in the difference between "(statistically) significant" and "meaningful", as discussed a couple of days ago. The differences, although unlikely to be the result of sampling error, are tiny — and also are small relative to within-group variance.
If we re-plot everything with a y-axis that starts at 0, this become clearer:
There's plenty of interesting and meaningful structure in conversational dynamics — but the effect of speaker and interlocutor sex on the distribution of speech segment durations is not a good example.
leoboiko said,
July 26, 2017 @ 11:38 am
I'm not sure I understand the line plots. I'm probably missing something obvious, but is the X-axis simply binary? Are the lines just visual guidelines between four data points?
[(myl) Yes and yes. In defense of this choice, you often see similar plots in psychology publications.]
Would scatterplots of the durations be a better choice than median plots, as they'd also illustrate the within-group variance? Perhaps four parallel scatterplots for the four possible cases, all to the same scale? What would be a good way to present graphically both the small inter-group difference, and the intra-group variance; boxplots?
[(myl) Those scatterplots would look like repeated shotgun blasts from an accurate shooter — it's that point that "statistical significance" talk often obscures.]
Cervantes said,
July 26, 2017 @ 1:35 pm
I have a large corpus of audio recorded and transcribed medical encounters. We know quite a bit about this situation. If you count speech acts, Drs. generally dominate patients about 60/40; but their speaker turn word count also tends to be greater. Gender of doc and pt doesn't matter much, as far as I know, although race does — black patients are typically found to talk less.
In motivational interviewing encounters, however, clients talk a good deal more than do counselors.
There's a great deal more analysis I could do along these lines but it probably wouldn't interest an NIH study section enough to pay for it.
[(myl) Indeed. But the conversational dynamics are interestingly different comparing adolescents with an ASD diagnosis with neurotypicals; and also different among elderly patients with different neurodegenerative disorders. And common sense says that there will also be differences as a function of personality, mood, engagement, social standing relative to the context, etc., which might have practical/pedagogical/clinical value.]
D.O. said,
July 26, 2017 @ 10:03 pm
If you count speech acts, Drs. generally dominate patients about 60/40; but their speaker turn word count also tends to be greater.
Shouldn't those be highly correlated? If someone speaks in larger fragments they would speak more, even if the number of turns is equal.
John Swindle said,
July 27, 2017 @ 7:02 am
D.O.: Are "speech acts" the same as "speaker turn" in this context? Does the noun pile "speaker turn word count" mean the number of words per speaker turn? If so, then the two don't have to be highly correlated. Doctors might speak more often (more speech acts), but patients might say more words each time they speak (higher speaker turn word count). Cervantes found that not to be the case. Doctors not only spoke more often, they also said more words when they did speak.
D.O. said,
July 27, 2017 @ 8:25 am
I understand "Drs. generally dominate patients about 60/40" as based on total speaking time or total word count. This can be achieved by speaking more turns with the same (or lower) per turn count or speaking the same (or lower) number of turns with greater per turn count. But it might be that Drs. speak both more turns and longer turns, on average. I don't understand which of these 3 scenarios Cervantes found in the data.
Cervantes said,
July 27, 2017 @ 9:20 am
No, speech acts are not the same as speaker turns. Speaker turns can consist of any number of speech acts. However, in any dialogue, the number of speaker turns is equal for each interlocutor, by definition. What I should have said is that doctors' speech acts also tend to have a higher word count, because patients' speaker turns are more likely to consist of low word-count acts such as acknowledgments and answers to closed questions. We have a taxonomy of speech acts, and we count them. So, for example, we know that doctors ask far more questions than do patients, and that they use a lot of closed vs. open questions within most components of an encounter. We can also distinguish between representative and expressive assertions of various kinds, directives, commissives, empathic statements, and so on. There is all sorts of asymmetry between the two roles.
Cervantes said,
July 27, 2017 @ 9:24 am
BTW Prof. Liberman may be interested to know that I've worked with Byron Wallace and others to automate labeling of speech acts and topics. This can get reasonable agreement with human coders using just a bag of words approach, although only with broad categories. I'm interested in improving this but don't know how fundable it is.
John Swindle said,
July 27, 2017 @ 4:23 pm
@Cervantes: Thank you for the clarification!
Ross Bender said,
July 30, 2017 @ 7:46 pm
Google Translate displays an interesting choice of gendered voices. For whatever reason, those languages that GT speaks are primarily voiced by women. I input the following poem by Gertrude Stein; my random sampling of languages follows [M=Male; F=Female]:
If lilies are lily white if they exhaust noise and distance and even dust, if they dusty will dirt a surface that has no extreme grace, if they do this and it is not necessary it is not at all necessary if they do this they need a catalogue.
Afrikaans – M
Arabic – F
Bengali – F
Chinese – F
Danish – F
French – F
German – F
Hungarian – F
Icelandic – M
Japanese – F
Khmer – F
Korean – F
Latin – F
Macedonian – M
Nepali – F
Polish -F
Russian – F
Swahili – M
Tamil – M
Thai – F
Welsh – M
John Swindle said,
July 30, 2017 @ 10:18 pm
@Ross Bender: The male and female voices that you mention for Google Translate are fundamentally different. I don't know how it's done, but the female voices sound like decent recordings of sampled words with fairly plausible intonation. The male voices sound like sketchy recordings of sampled phonemes with little intonation. I'm guessing that what we hear as male voices are placeholders until the developers can do these less-frequent languages properly.