Significant (?) relationships everywhere
« previous post | next post »
While we're on the subject of maybe-meaningful data-mining output, let me share with you some semi-refined ore from the dataset of real-estate listings that I mentioned the other day.
I've collected all the (non-foreclosure) listings for 8 cities from trulia.com — about 50,000 listings altogether — and extracted the descriptions, e.g.
Truly,"A Diamond in the Desert".From the lovely dbl. door glass entry out to the gorgeous yard with oversized pool, you will not be disappointed. All rooms are open and airy. The large kit. has a cntr.island w/cooktop. The raised bar area has a sink and area for sitting. There is a lg. room upstairs w/wet bar-perfect for a media or hobby room.The master ste. is large with a beaut.sitting area for relaxing + fab.WI closet.
or
This pre-war one bedroom home is located on a high floor on a beautiful tree lined block. Open northern exposures from each room with beautiful city views, and a spectacular view of The Cathedral of Saint John the Divine. The apartment has recently been completely renovated without removing the original pre-war charm. Features include beamed ceilings, original oak wood flooring, stainless steel appliances, and baseboard moldings. Part-time doorman 3 PM-7 AM, live in super, bike room, storage, and laundry. Pied a terre's, gifting, co-purchasing are permitted with board approval.
I then tokenized the descriptions, created a histogram of (monocased) tokens (roughly, "words") for each city, and normalized the counts to the scale of "occurrences per million tokens". Pick a random word, and there's a good chance that there are large differences in its frequency between listings in different cities — and when the counts are large, as they are in all the examples I'll show you today, such differences are "statistically significant" to a massive degree. (There are also often differences in counts by price, and also in counts by price by city, but that's another set of stories.)
Whether the differences are "significant" in any senses other than the "not likely to reflect sampling error" sense — and what those other senses might be — is an open question.
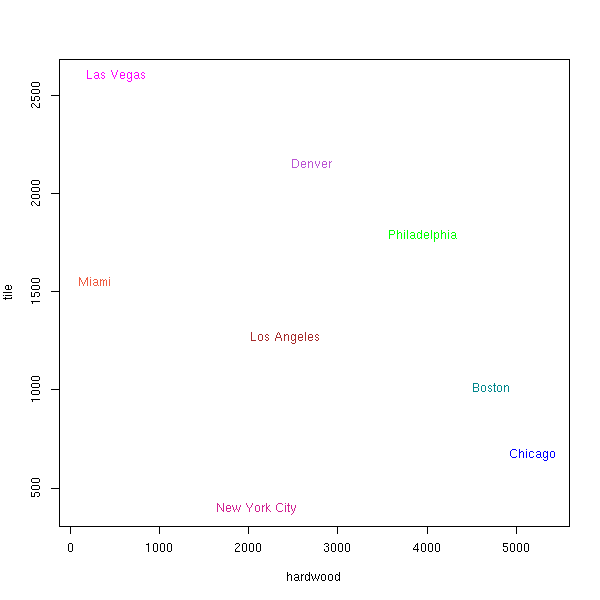
Just for graphical fun, I've plotted the word frequencies in pairs. Here's the hardwood/tile space:
Makes sense, right?
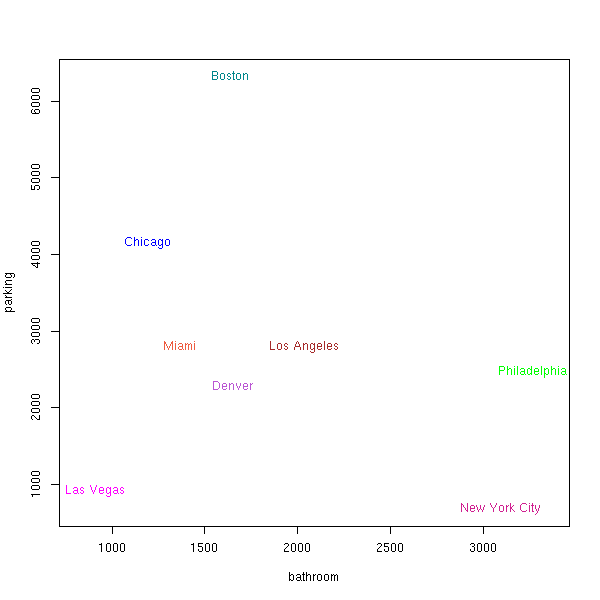
Here's bathroom/parking:
Also makes sense, I guess — at least I could make up a story about it. [Update: and the NYT has a story today about two outdoor parking spaces in Boston selling for $560,000.]
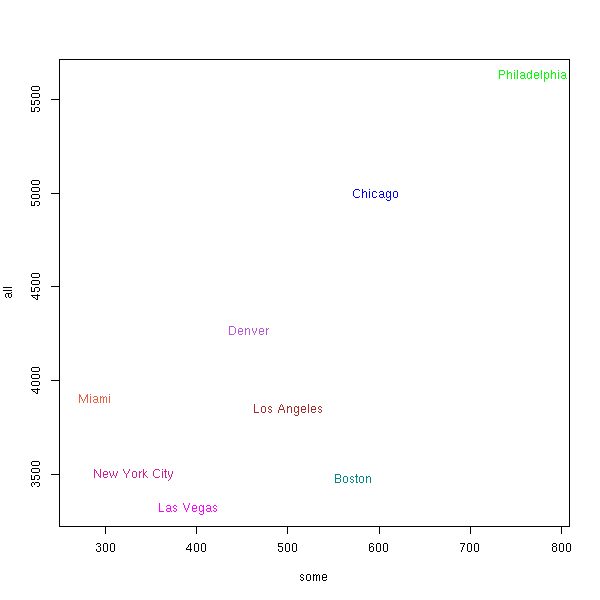
But how about some/all:
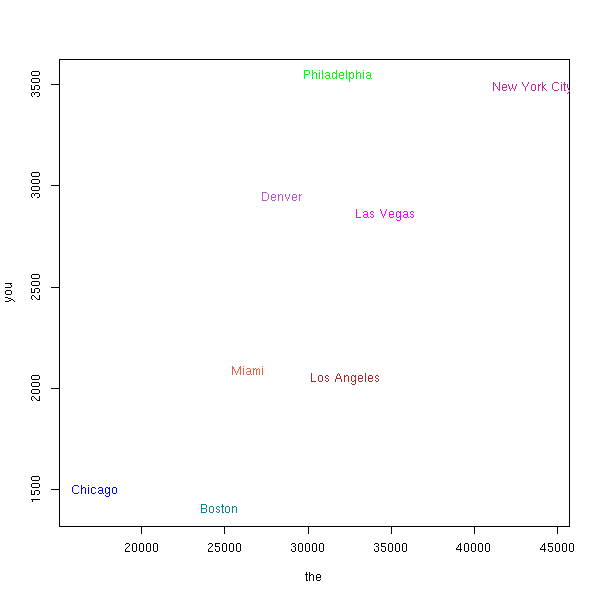
Or the/you:
I haven't done any cherry-picking here, in the sense of trying lots of things and just showing you the good stuff. These are just the first few pairs of words whose geographical distributions I thought might be interesting. In fact, it's not easy to find words whose rates of usages are NOT correlated with geography, to a similar degree, in these different sets of listings. Presumably these differences have reasons — in the distributions of things typically described, in the phrases typically used to describe them, in purely stylistic local habits, or (occasionally) in random sampling variation.
But as I noted in my earlier post, once such sets of datasets are available, it's not hard to find patterns in and among them. And the counts are large enough that relatively few of the apparent patterns can be attributed purely to sampling error — though it's hard to know how to correct for multiple comparisons in such cases.


Mark F. said,
June 14, 2013 @ 12:14 pm
Is it more accurate to say it's not hard to find patterns in it, or it's hard not to find patterns in it?
Pretty cool stuff.
Faldone said,
June 14, 2013 @ 12:53 pm
Is this a subset of pareidolia?
Roger Lustig said,
June 14, 2013 @ 10:23 pm
J Chester Farnsworth named it: The Origin of the Specious by Selection of Natural Means.
cM said,
June 15, 2013 @ 6:14 am
It would be interesting – though probably useless – to see if this is reversible:
Can a specific listing be matched to its city just by using a couple of the most…
uhm… significant "keyword densities"?
Linda Seebach said,
June 15, 2013 @ 9:30 am
@cM:
Probably. It sounds a little like Kieran Healy's exposition of how George III's British government could have identified Paul Revere as a dangerous revolutionary just by data-mining colonial club membership lists. (He is, of course, not writing about Paul Revere.)
http://kieranhealy.org/blog/archives/2013/06/09/using-metadata-to-find-paul-revere/
Keith said,
June 17, 2013 @ 4:54 am
I find this an interesting analysis.
I suspect that there are several mechanisms at work, though, and it would be more interesting to see some more detailed analysis that attempts to identify those mechanisms.
The two that I can think of right now are:
1. that the tokens represent the idiolect of the writer and the target, and so there will be regional differences of usage,
2. that the tokens represent typical architecturally dominant features (such as hardwood floor v. tiled floor).
On the other hand, the "typical architecturally dominant features" might also be balanced by a need to point out some "unique feature" of a home, for example in a city where off-street parking is commonplace it might not be mentioned, while in a place where it is rare it would certainly be mentioned.
Eneri Rose said,
June 17, 2013 @ 3:17 pm
Am interested in knowing if "boasts" is regional, as in, "this house boasts hardwood floors". This always rankles me because it seems to me that an inanimate building is incapable of boasting.