First quantitative notes on ModPo2 posts and comments
Here are a few simple summary numbers and plots, based on a couple of .csv files that Ritika created from the 11/7/2013 data dump, covering about two months of the discussions.
As of 11/7, there were 52,392 posts from 3,377 participants; and 34,395 comments from 2,100 participants. 3,559 participants contributed at least one post or one comment.
The rate of participation is of course highly skewed: The most prolific poster contributed 1,452 posts and 969 comments; the most prolific commenter contributed 597 posts and 1,530 comments. 777 participants contributed just one post each, and 618 contributed just one comment each.
There were 13,262 posts with at least one comment -- 39,130 posts had no comments.
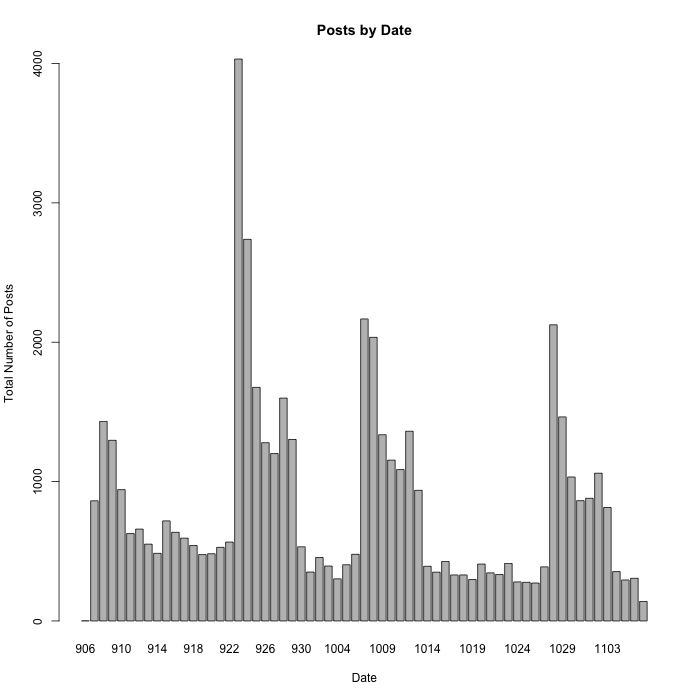
The distribution of posts over the eight weeks shows a spike at the end of September, with steady participation through October:
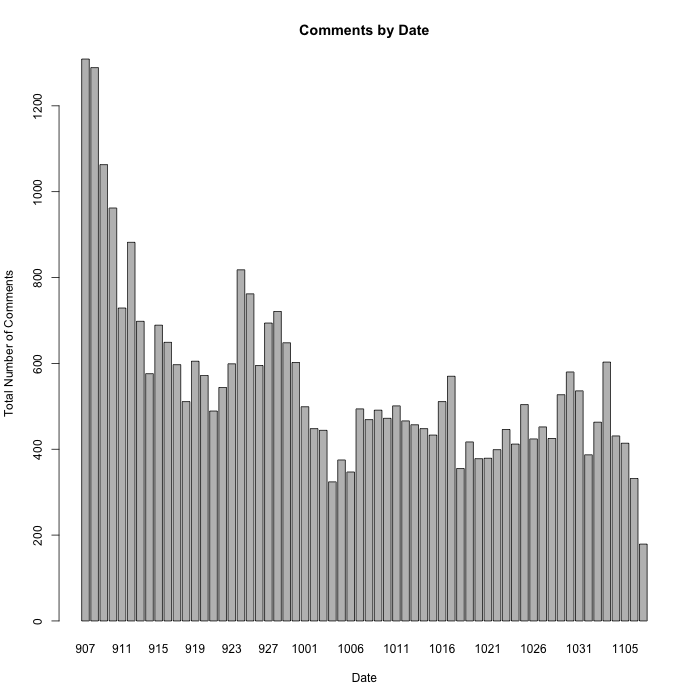
The comments show a gradual fall-off during September, with steady participation in October:
(As I understand, the things denominated as "posts" or "comments" are actually of several different types; we should look into how to tell them apart.)
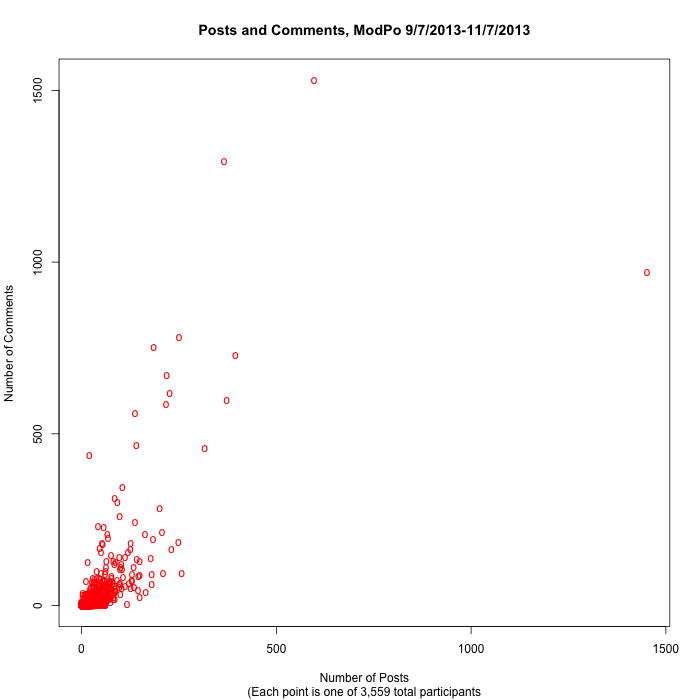
If we plot the number of posts and comments for each participant who contributed at least one post or at least one comment, we can see that there are a few prolific outliers, with most participants down in the region of <100 posts and/or <100 comments:
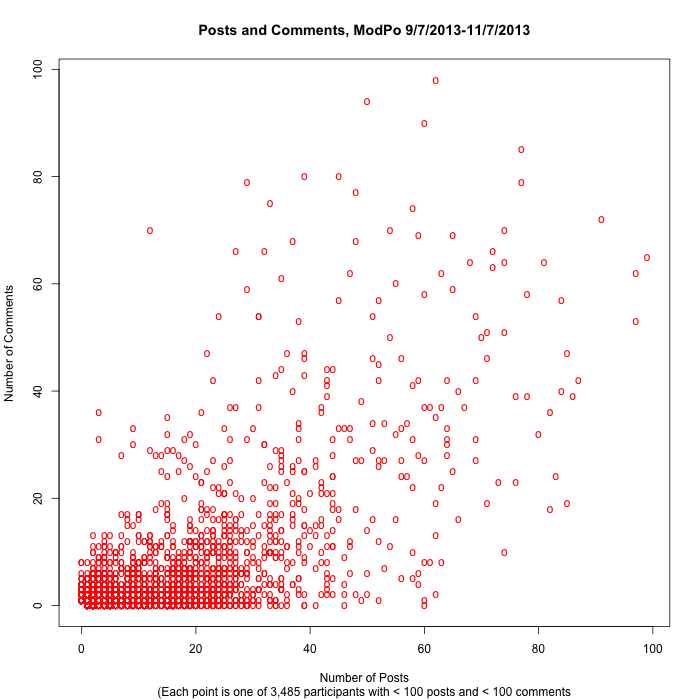
So showing just that region:
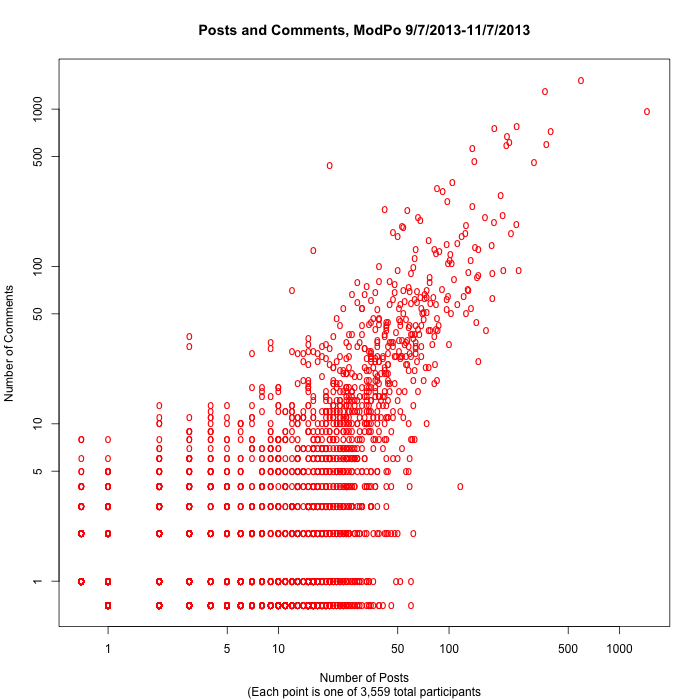
Or plotting on a log scale (with a small trick to include the points with 0 posts or 0 comments):
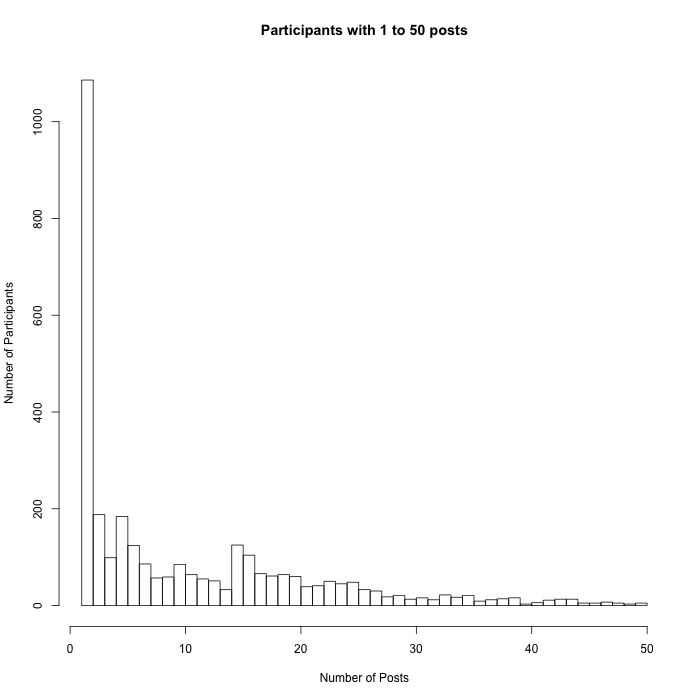
Here's a histogram showing how many participants contributed between 1 and 50 posts:
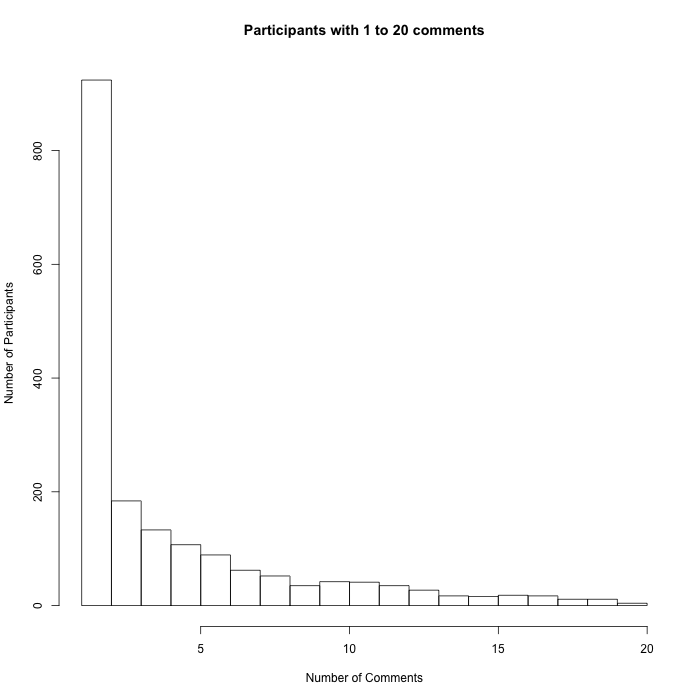
And here's the same thing for participants with 1 to 20 comments:
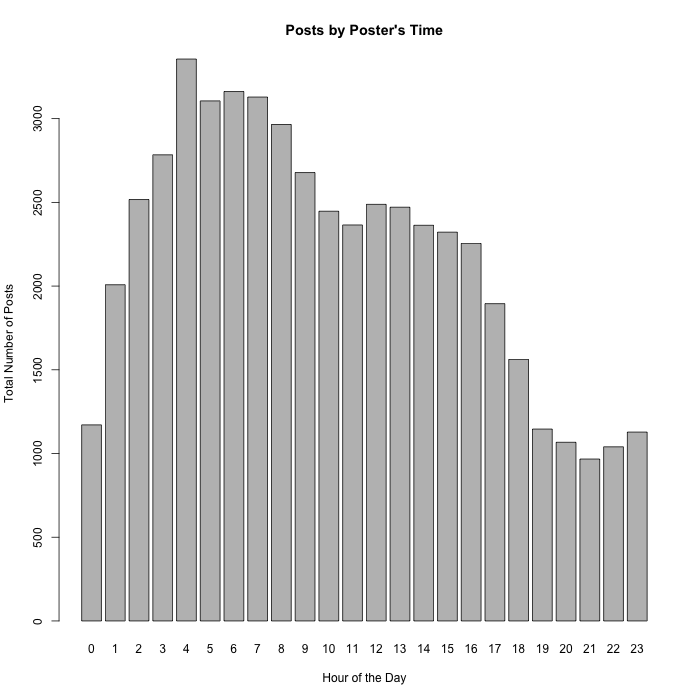
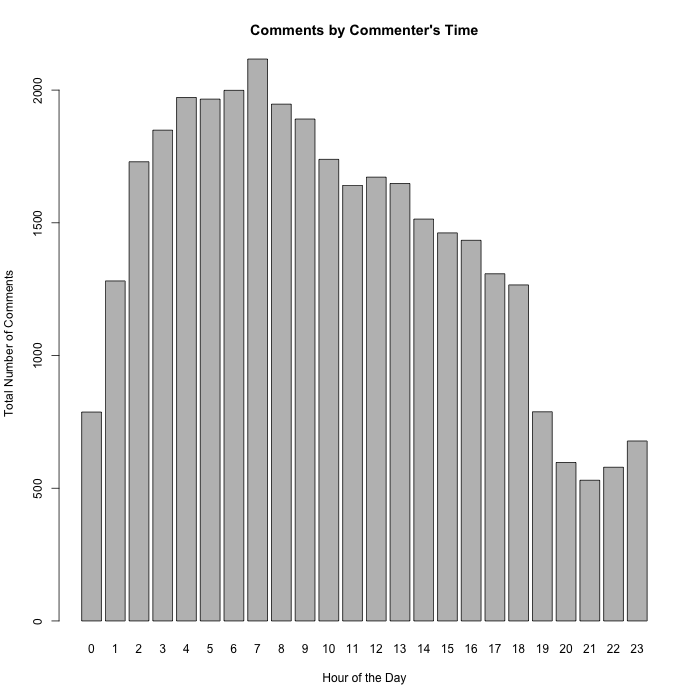
If I've done the time-zone conversion correctly (and I did not try to deal with Daylight Savings issues), participants tend to submit posts in the wee hours of the morning, especially from about 2:00 a.m. to 8:00 a.m.:
The largest number of posts come from the Pacific time zone (-8 hours relative to UTC), with the Eastern time zone (-5 relative to UTC) next:
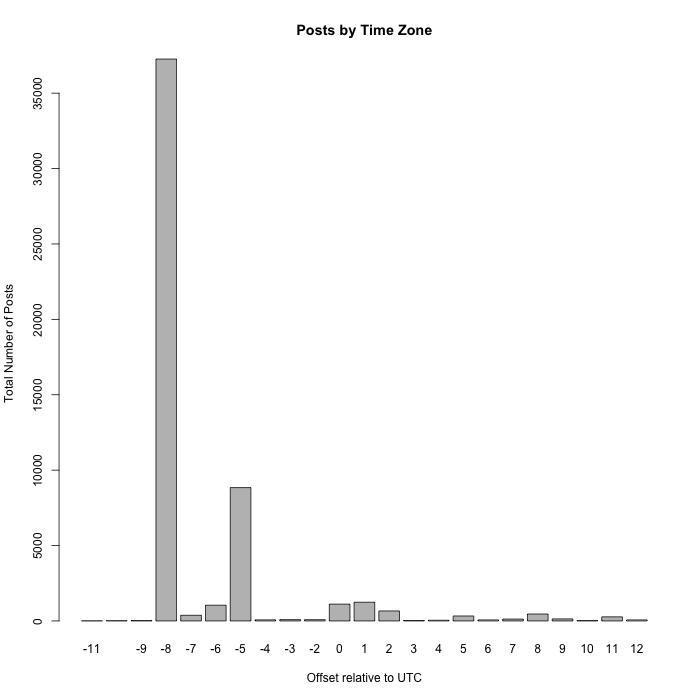
One curious thing, maybe a Coursera bug. They report "Time Zone" as "Region/City", e.g. "Africa/Cairo", "Europe/Paris", or "Asia/Tokyo". In some cases, they seem to collapse all cities within a given country to a single representative. Thus there are 13 posts and 13 comments from "America/Vancouver", and there are 37,250 posts and 20,903 comments from "America/Los_Angeles", but there is nothing from any other (nominal) cities in the 8-hours-before-UTC time zone -- nothing from San Francisco or Seattle or Fresno or wherever. However, the UTC-5 time zone, they give "America/Detroit", "America/Indiana/Indianapolis", "America/Indiana/Knox", "American/Indiana/Petersburg", "American/Kentucky/Louisville", and "America/New_York", as well as "America/Montreal" and "America/Toronto" in Canada. But nothing from e.g. "America/Philadelphia" or any other EST U.S. city.
N.B. It seems that this is indeed a Coursera flaw -- rather than registering time zones based on the IP address a post or comment is submitted from, they use the time zone specified in the user's profile. This is California time by default, and many (most?) people never bother to change the default, no matter where they live...
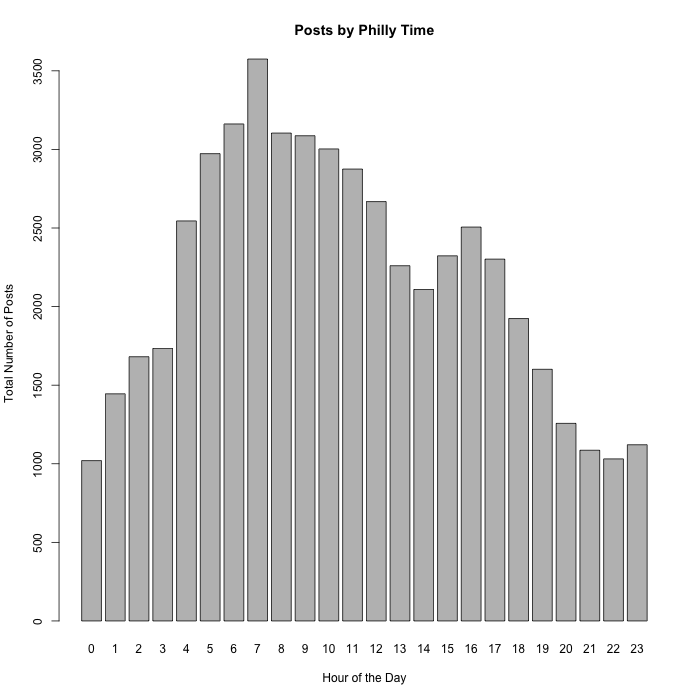
Anyhow, translated into Philly time, the peak posting time is around 7:00 a.m.:
The comments are maybe a bit later, but the wee hours still dominate:
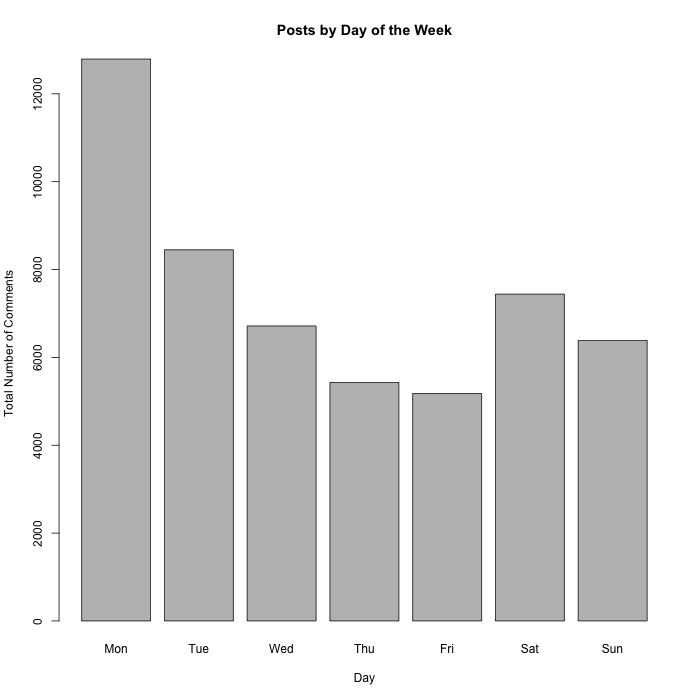
Posts are most common on Mondays, as expected:
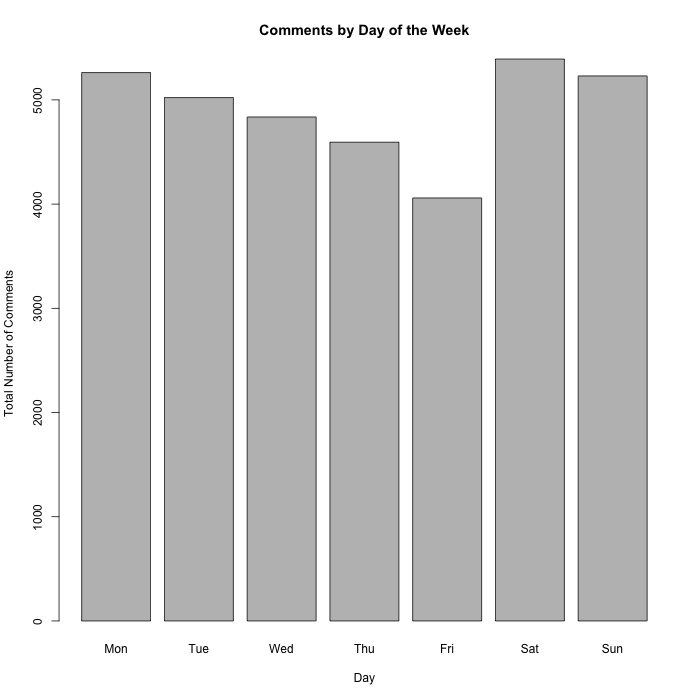
Comments are more evenly spread through the week:
The number of posts with > n comments, for 1 <= n <= 50:
 [1] 34395 27474 22504 18616 15652 13062 11178  9386  8130  7068  6268  5487
[13]  4779  4246  3728  3353  3049  2777  2489  2280  2120  1868  1758  1643
[25]  1475  1325  1117  1090  1062  1004   884   822   790   757   689   619
[37]   583   546   508   430   350   350   308   308   264   264   218   218
[49]   170   170
And a plot showing the number of posts with n comments, for 1 <= n <= 20:
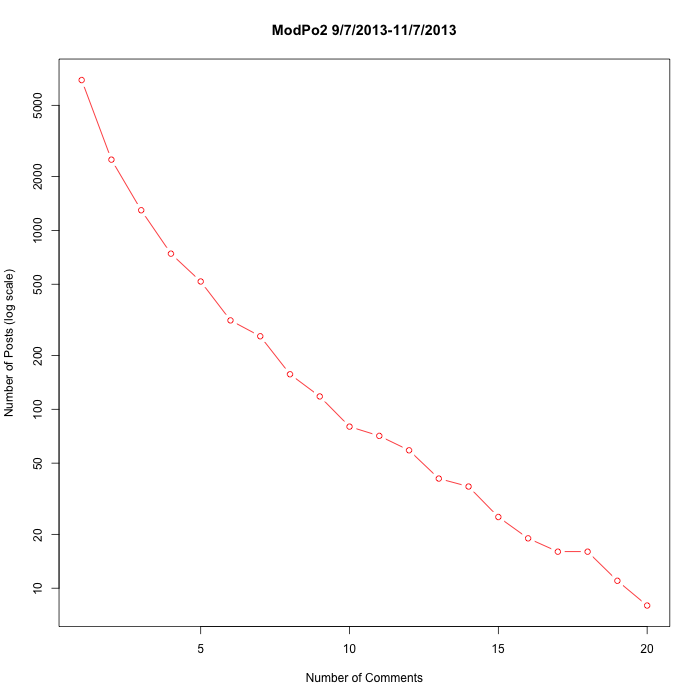
Another way to look at the same data is the empirical probability of stopping as a function of the current number of comments in a thread, which is about 52% after one comment (and 39130/52392 = 75% for a post with no comments!), but falls to around 10% after 20 comments:
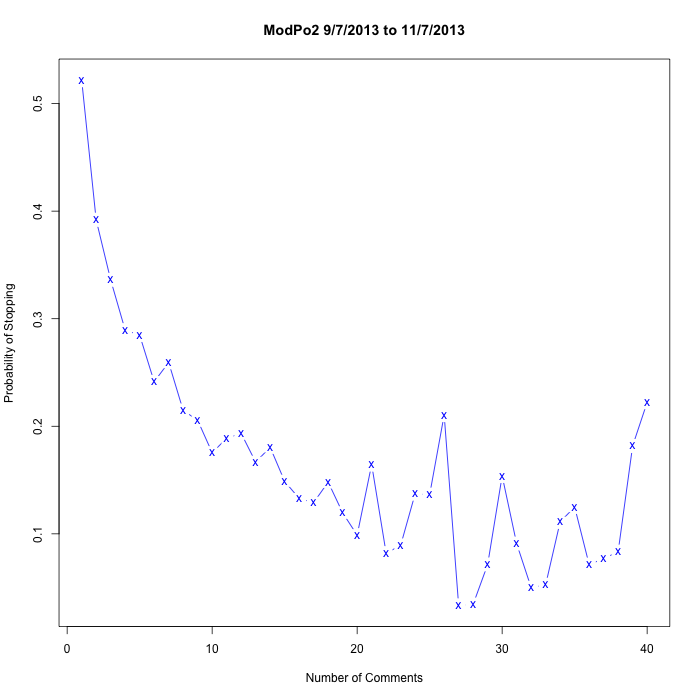
This looks promising for modeling the factors that lead to threads ending or continuing, since there are plenty of threads of various lengths, and the first and simplest factor, namely the length of the thread so far, is an effective predictor.
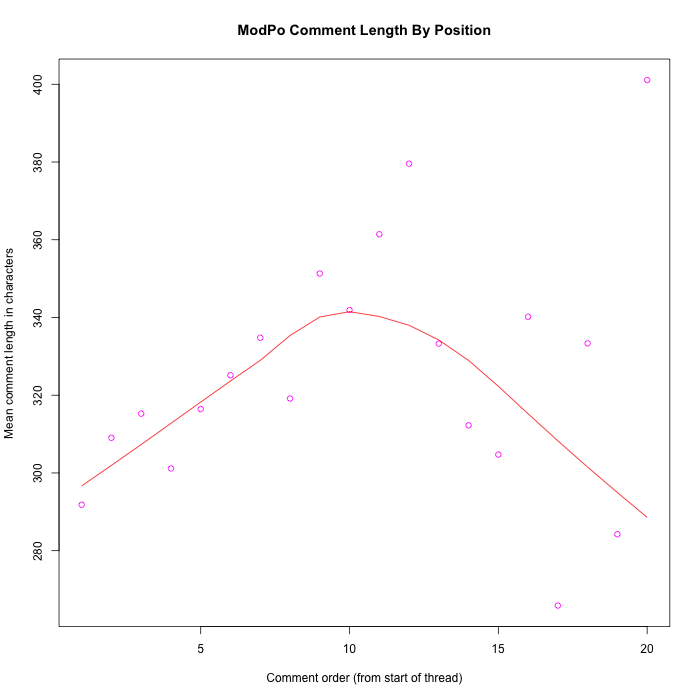
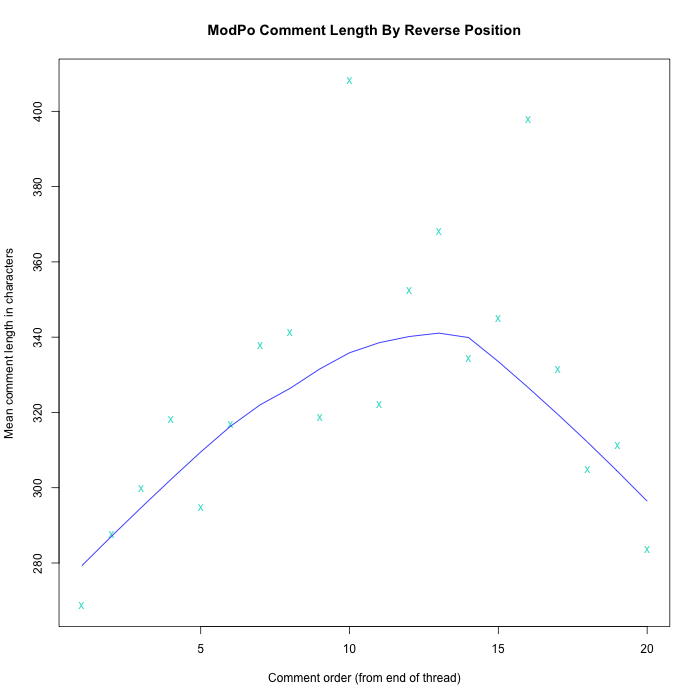
To a first approximation, it looks like comments tend to be longer in the middle of a thread rather than at the start or the end: